Editor’s Note: This text course is an edited transcript of a live webinar. Download supplemental course materials: AURICAL quick fit guide; course handout; OnTarget information.
Angela Flores: I am Angela Flores, and I am a consultant with Otometrics and Audiology Systems. This is an introductory course for probe microphone measures (PMM). We will briefly talk about the company and what products we offer, and then we will get into the heart of the topic which is verification and why we should do it. We will discuss the AURICAL and basic probe microphone terminology. We will go through the AURICAL PMM step by step, and lastly, we will talk about other tools available within PMM as well as other resources.
Otometrics/AudiologySystems
Who is Otometrics/AudiologySystems? You may have seen these company names and logos in some of the trade journals. Audiology Systems was created two years ago to become a full-service distributor of Otometrics. Otometrics is a manufacturer of equipment; Audiology Systems is the customer-focused equipment distributor. If you have questions about what equipment we carry or how we can help you in your practice, please call our customer service partners at 855-283-7978, or visit us online at www.audiologysystems.com.
Otometrics and AudiologySystems offer a full line of product solutions from software integration, hearing assessment equipment, fitting equipment, to balance assessment and rehabilitation. Central to all of that is OTOsuite. OTOsuite is the software platform that integrates select Madsen and AURICAL instrumentation and provides access to everything you need for the entire client journey. It is efficient and it is intuitive.
What is Verification and Why Should We Do It?
As some of you are aware, only about 30% to 40% of hearing health care professionals conduct probe mic measures. Today we will talk about why we should be doing it. Let’s look at verification versus validation. Those terms are sometimes used interchangeably, but they should not be, as they are two different things.
Verification is an objective measure to determine if the hearing instruments meet a particular standard and are performing as expected. If we are running probe microphone measures to see if we matched a prescriptive gain target, we are performing verification.
Validation is more subjective and is utilized to determine how effective the hearing aids are for the person who is wearing them. How much benefit does the patient get? Examples of validation would be questionnaires such as the Client Oriented Scale of Improvement (COSI; Dillon, James, & Ginis, 2004), the Abbreviated Profile of Hearing Aid Benefit (APHAB; Cox & Alexander, 1995) or the TELEGRAM assessment tool (Thibodeau, 2004). How well are they doing once they have been fit?
Let me provide an analogy. A friend made me a carrot cake from his grandmother’s recipe. Every recipe has a very particular set of ingredients and measurements that are included. If I very carefully measure one cup of flour, that is verification. Once the dish is baked and we taste it, and he says it tastes just like his grandma’s. This is validation. Both verification and validation are important as part of the steps for a successful fitting.
Why Should we Conduct Probe Microphone Measures?
PMMs are a form of verification. One of the first reasons that we should do it is because the guidelines from the American Academy of Audiology (AAA) and the American Speech-Language-Hearing Association (ASHA) consider it part of best practice. What you see on the manufacturer’s fitting screen very well may not be what is happening in the patient’s ear.
Other reasons include patient satisfaction, fewer return visits for adjustments, and demonstration of key hearing instrument features, such as noise reduction, to the patient. It may help the patient understand those features and improve their satisfaction.
AAA Guidelines
AAA’s Guidelines for Audiologic Management of Adult Hearing Impairment (Valente, Abrams, Benson, Chisolm, Citron, et al., 2006) are considered best practices in our field. As the signal of choice, AAA recommends that speech or a speech-like signal be used. In order to fit an adult with a hearing aid properly, the AAA guideline indicates checking the physical fit for comfort. They recommend checking the occlusion effect, gain verification, output verification, aided sound field thresholds, and verification of special features such as directional microphones or telecoils. Many of these things are conducted via probe microphone, including the occlusion effect, gain verification, output verification, and verification of special features.
Importantly, what you see on the manufacturer’s screen may not be what is happening in the ear. The only way to know is to measure it with a probe microphone. One study by Aazh and Moore (2007) demonstrated this point. They used four different manufacturers and used the manufacturers’ software to match gain to NAL-NL1 targets. Then they conducted real-ear gain on 42 different ears. They found that 64% failed to come within plus or minus 10 dB of targets at one or more frequencies between 250 and 4000 Hz. In other words, 64% of the manufacturers’ fittings did not come within 10 dB of target.
Another study by Aazh, Moore and Prasher (2012) looked at matching target gain in open fittings using NAL-NL1 from one manufacturer. Of 51 ears, 71% did not come within plus or minus 10 dB of targets. The greatest discrepancy was 18 dB. The patients who were off by 8 dB at 1000 or 4000 were likely not even getting audibility, which is the reason you are fitting the hearing aids.
If you want to improve patient satisfaction, MarkeTrak VIII (Kochkin, 2010) shows a correlation between the dispensing protocols and a successful patient outcome. In other words, the steps you take when fitting a hearing aid have a direct impact on how happy that patient will be with the hearing aid. This MarkeTrak study (Kochkin, 2010) showed that when the professional conducted real-ear measurement verification, there was a 20% increase in satisfaction. If they did an objective benefit measurement, there was a 26% increase. If they did a loudness discomfort measure, there was a 24% increase. The steps you take have an impact on the success of the patient.
The PMMs do make a difference, and they are the only way to know what is happening in that patient’s ear canal. It offers you objective guidance in your fittings, not only to know that you are providing audibility, but also to help troubleshoot potential problems. As mentioned previously, it provides you the opportunity to demonstrate features and counsel appropriately.
Goals
What might your clinical goals be for PMM? Do you want to match a prescription target, and if so, which one? Do you want to make the speech audible and comfortable? Do you want to make sure that the sound is subjectively acceptable to the patient? What about counseling? Perhaps your goals include several of these.
Prescription Targets
The two most commonly used target methodologies are NAL (National Acoustic Laboratories) and DSL (Desired Sensation Level). There have been several versions of both, but the current versions are NAL-NL (non-linear) 2 and DSL 5. NAL-NL2 is a threshold-based algorithm that aims to maximize speech intelligibility at any level while keeping the overall loudness of speech at or below normal overall loudness. DSL aims to normalize loudness at each frequency. Loudness equalization aims to equalize the perception of loudness over a range of frequencies instead of having lower frequencies dominate loudness, as is the case for those with normal hearing.
DSL targets are available for children and adults. For children, DSL targets are available for congenital as well as acquired losses. In general, DSL 5 targets are about 7 dB lower for adults than they are for children, and there are also different targets for quiet versus noise in DSL 5. NAL-NL2 now has considerations for gender, age, and level of experience.
Everyone wants to know the difference between NAL-NL2 and DSL 5. There is not a black-and-white difference. It depends on patient age, input level, gender, frequencies with hearing loss, et cetera. Figure 1 shows a snapshot comparing NAL-NL2 (green line) and DSL 5 (blue line) for an average input of 65 dB in an adult with high frequency, sloping hearing loss. In general, DSL will call for more high-frequency gain than NAL-NL2. Speaking in very broad terms, DSL for adults will call for more high-frequency gain.
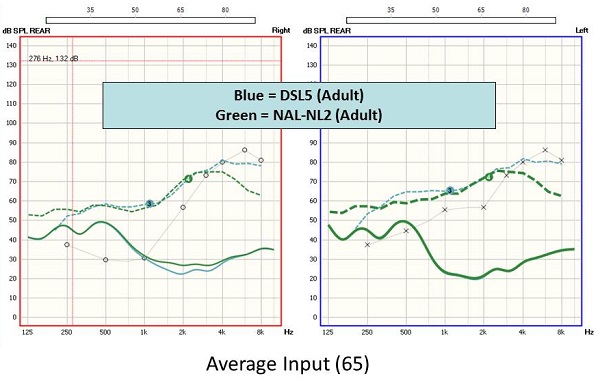
Figure 1. Comparison of NAL-NL2 (green line) and DSL 5 (blue line) targets for a sloping, high frequency hearing loss, using a 65 dB input.
The AURICAL PMM system offers DSL 5 as well as NAL-NL2. The older versions are also there, should you want them. You can also enter your own manual targets should you need that feature for research. Remember that hearing aid manufacturers’ proprietary targets are not the same thing as NAL or DSL, even if they are based upon them as a starting point. If you fit to manufacturer ABC’s target and expect to match NAL target, it will not happen. You are comparing apples and oranges.
AURICAL Overview
AURICAL is a product name that includes three different equipment components. These can be bought individually or together as a system. If you want the probe mic, but not the hearing instrument test (HIT) box you can buy those separately. There is the AURICAL AUD, the AURICAL HIT, which has a vertical design with very small footprint, and AURICAL PMM (Figure 2), which includes the collar and speaker. Today we are focusing on the PMM component.
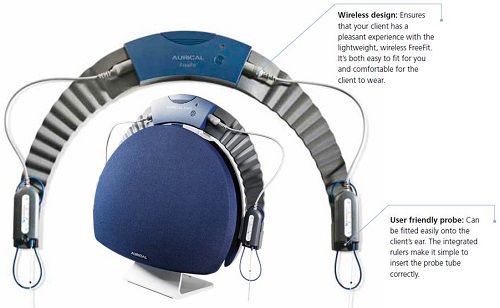
Figure 2. AURICAL PMM unit with collar and speaker.
You can see the wireless collar and the speaker in Figure 2. There are no more cumbersome cords. It is also binaural so you can measure both ears simultaneously. There is a button that will do the calibration for you quickly. It includes user-friendly probes and pre-defined measurement sequences to make it efficient and easy for use. No matter what your defined goals are, the AURICAL PMM can help you achieve those.
Terminology
Let’s look at basic terminology for probe microphones. The terms “R” and “G” can be confusing. If it is an “R” value, it refers to an absolute response and measures dB SPL. It is the sound pressure level. The “G” means gain, and it refers to a difference value. That is what gain is. Generally, the input level is subtracted from the output to determine gain.
REUR
There are several common measures associated with real-ear measurements. The real-ear unaided response (REUR) measures the natural resonance of the ear canal and concha. The ear has a natural resonance in the 2000 to 4000 Hz range (Figure 3). In other words, when 65 dB goes into the ear, the output curve shows how the ear amplifies that signal. This is one of the first measures you might conduct as a useful reference point. If you do not know the natural response of the ear, how can you compare that to a response from the ear with an open-fit hearing aid? You may not know if it is really open, which leads us to our next measure.
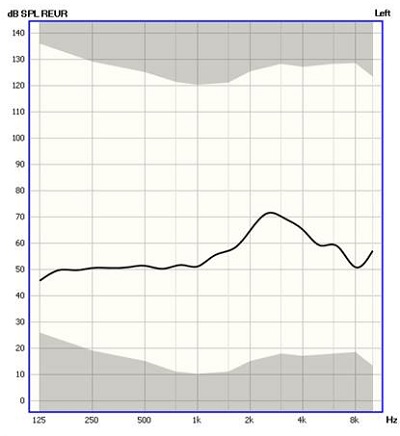
Figure 3. The REUR, showing the natural ear canal resonance between 2000 and 4000 Hz.
REOR
Our next measure is the real-ear occluded response (REOR). We might want to measure the REOR, especially if we planning on an open fitting. Figure 4 compares the REUR (black) with the REOR (pink) - the hearing aid is physically in the ear, but off. There is a big difference between these two lines indicating that the hearing aid occupying the ear canal has a significant effect on the natural ear canal resonance. This example is not achieving an “open fit.”
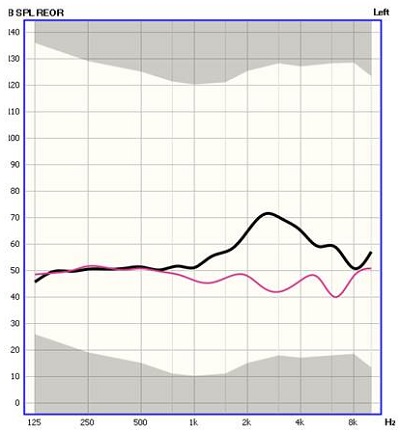
Figure 4. REUR (black) compared to REOR (pink). The ear has been occluded by a hearing aid that is not turned on.
We can also easily determine the gain response by subtracting the input level from the total output. A button will toggle between the REOR and the REOG, and the software will automatically calculate the difference and change the display to see a gain value as opposed to a response value.
Figure 5 shows a dB SPL scale with a REUR and REOR. There is not a big difference between the two. The hearing aid is not causing any negative effects on the natural amplification of the pinna, concha and canal. That means that this is an open fit. We would not know that it was truly open unless we measured it.
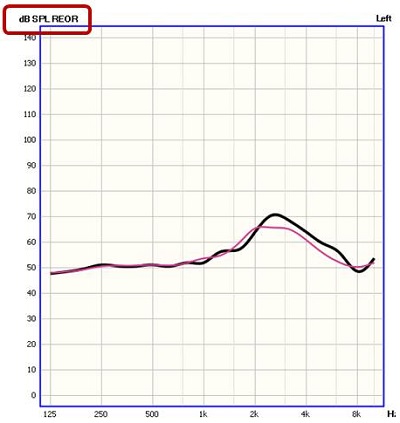
Figure 5. REUR and REOR in an open fitting. The hearing aid in the ear canal does not occlude the ear canal.
REAR
Let’s look at a different term, which is real-ear aided response (REAR). We went from measuring the ear open with nothing in it, putting the hearing aid in (occluded but off), and now we will turn the hearing aid on to measure the REAR. We want to see how the hearing instrument is amplifying. The REAR measures via the probe mic in the ear canal that sound is delivered. The thick, dashed blue line is the target in Figure 6. We want to try to match that target if we can. The solid, thin blue line is the response of the hearing aid. From this, you can see that we are not matching target well in the high frequencies.
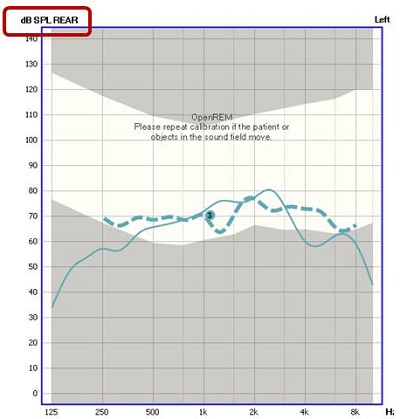
Figure 6. REAR (thin blue line) compared to the prescriptive targets (dashed blue line).
The real-ear aided gain (REAG) is a measurement of what amplification is being provided to the ear with the input signal subtracted. In other words, we are looking at what the hearing instrument is providing, not a sum of the signal plus the hearing instrument. Instead of looking at it as a response, we are looking at it as gain. Figure 7 shows a REAG where we have not matched target very well.
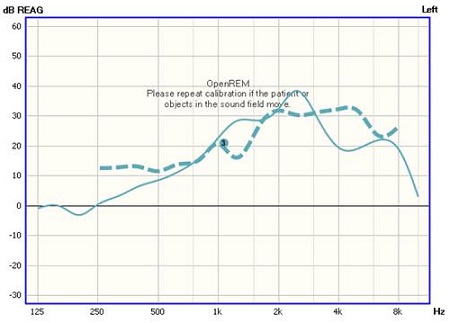
Figure 7. REAG (solid blue line) compared to the prescriptive targets (dashed blue line).
Real-ear ear insertion gain (REIG) subtracts out the unaided response and shows the effect of the hearing aid gain only. Take out the signal and the response of the natural ear, and you will see what only the hearing aid is providing.
AURICAL PMM Step-by-Step
Please refer in your handout to AURICAL PMM Quick Guide. OTOsuite is the software that can run standalone via NOAH (Figure 8). In the software, you will see several different product modules available depending on what equipment you have connected. One of the modules is the PMM. Remember that OTOsuite is a software application that allows you to integrate all of your different equipment, streamlining the control of your workflow, eliminating the need to duplicate actions such as entering the patient demographics, tests results, et cetera. When I move from my audiometer to my probe mic equipment, I do not have to re-enter the audiogram because it is already there. It saves time and keeps you from making mistakes.
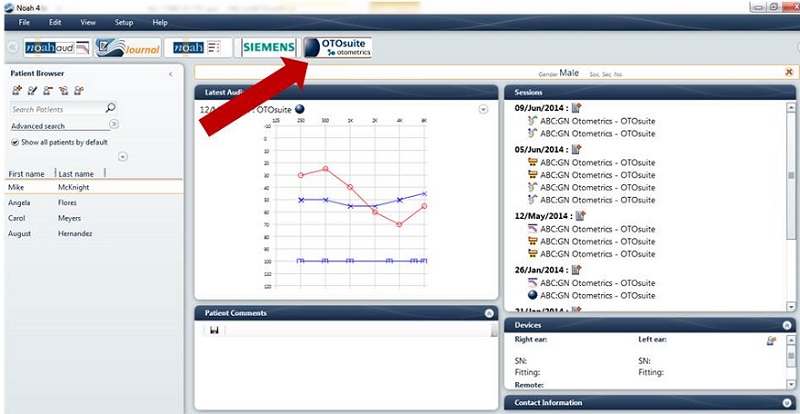
Figure 8. Screen shot of OTOSuite from within NOAH.
Once you are in OTOsuite, go to Navigator. This allows you to move between different pieces of equipment, and Control Panel allows you access to all the controls available on that selected piece of equipment. In today’s example, we are going to be working with PMM. Figure 9 is the Navigator view, and within PMM, I can readily access the different real-functions we discussed previously. Freestyle lets you make whatever measure you want to make.
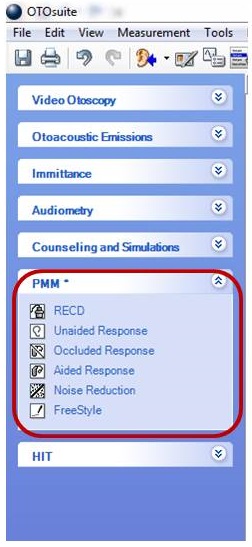
Figure 9. PMM menu items within OTOSuite Navigator.
A Note about Coupler-Based Fittings
While today’s focus is not coupler-based fittings, I do want to spend a minute talking about that. In coupler-based fittings, you are doing the majority of the hearing instrument programming and verification in the test chamber. Real-ear to coupler transforms and measurements are made in the test chamber when PMM is not possible, often with uncooperative patients or children. It is an approach that results in predictions of real-ear instrument performance while considering the patient’s individual ear acoustics, because you do have to measure a REUR. It eliminates the variability associated with sound field measures. All hearing instrument programming and verification is conducted under highly controlled acoustic conditions within the test box. You complete the same steps you would do with probe mic in the test box with minimal participation on behalf of the patient.
Audiogram
I showed you how to launch PMM from the Navigator in OTOSuite. If you are working from within NOAH, the audiometric data will be carried over to PMM. If you are working on the stand-alone platform and need to enter the audiogram, click on Tone and then Manual Entry (Figure 10).

Figure 10. Screen shot identifying how to enter an audiogram manually into OTOSuite.
Before you conduct any measurements, you have to calibrate the probe. Figure 11 shows a view within PMM after choosing Control Panel. Control panel allows you to choose the measurement that you want to perform, but it will require calibration before you can proceed. Calibration ensures that you are taking out any effects of the probe tube. It is important to do this with each new patient, assuming you are using a new probe tube for each patient.
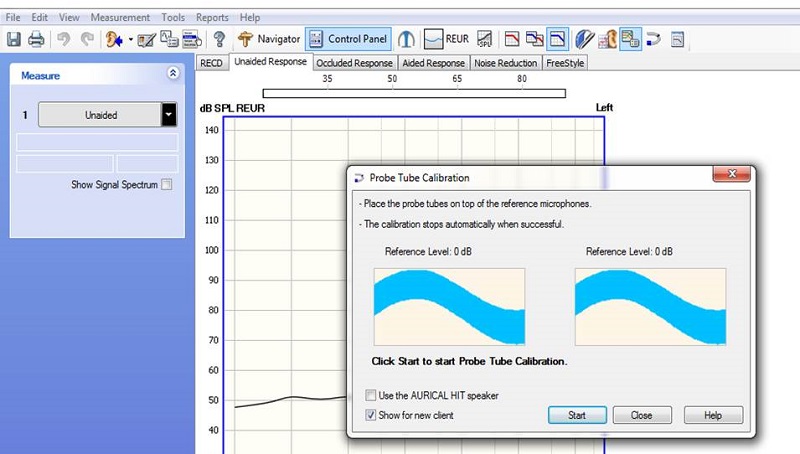
Figure 11. Screen shot of probe tube calibration screen within Control Panel of OTOSuite.
The following video shows a demonstration of this:
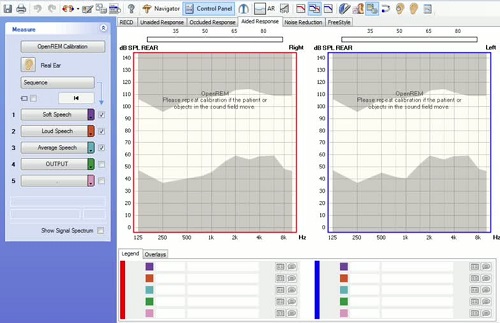
A dialog box will appear once the calibration is successfully completed. One quick tip is to make sure that the probe tube is not touching the blue rubber band that is placed around the pinna for retention. This can cause excessive noise or vibration, causing the calibration to fail.
Patient Setup
Drape the AURICAL PMM collar around the patient’s neck (Figure12). Hang the probe housings around the patient’s ears, and adjust the blue rubber cords to fit the ear snuggly; just pull down on them. Position the patient at 0 degrees azimuth, about three feet from the speaker to the speaker. Remember that this is a binaural system, so you do not want to put them at 45 or 90 degrees.
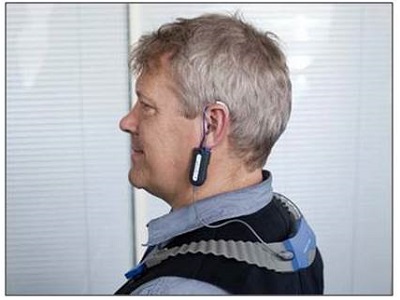
Figure 12. Patient setup of the AURICAL PMM collar on the patient’s neck.
Insert the probe tube in the ear canal to a depth that is appropriate for the patient, their age and their gender. General guidelines are:
- Adult male – 30 mm past the intertragal notch
- Adult female – 28 mm past the intertragal notch
- Children – 20-25 mm past the intertragal notch
There is a small black guide on the probe tube with a built-in ruler that will help you measure that before placement. You want the black marker to fall on the intertragal notch of the ear.
Fitting Details
Every fitting is not the same. Are you fitting an open behind-the-ear (BTE) hearing aid or a completely-in-the-canal (CIC) aid with no vent? Do you prefer to use DSL for one patient and NAL2 for another? Make sure the measurements reflect these differences.
The fitting details dialog box can be found under by choosing the icon that looks like a hearing aid with a pen, or by pressing F10. It is important to customize these options for each patient, which includes selecting the desired target.
The Fitting Details dialog box is shown in Figure 13. Be sure to check “use OpenREM calibration” if you are fitting an open instrument. You may want to also check “show for each new client,” which will allow the Fitting Details dialog box to come up for each new patient. Make sure the correct target is selected, as well as instrument type, venting, and other drop-down options that you want.
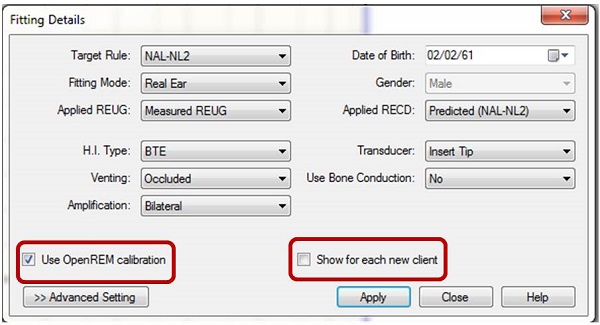
Figure 13. Screen shot of the Fitting Details dialog box and options.
There is an option here to select which REUG is applied. In other words, if you measured the REUG, or the natural resonance of the ear, and you want to use that, be sure to choose it from the drop down menu. Otherwise, predict it according to the formula that you are utilizing.
Advanced Settings
There are also Advanced Settings (Figure 14) which you may want to access for each patient. That depends on if it is needed to further ensure the accuracy of your targets for the measurements. It gives you the ability to change the program type, number of channels, compression type, and client type.
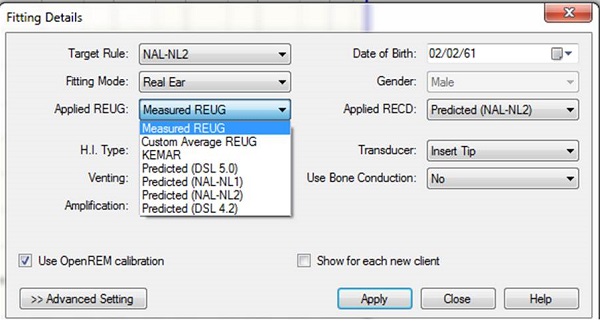
Figure 14. Screen shot of the Advanced Settings in the Fitting Details dialog box.
Running PMM
Prescriptive, target-based fitting falls under read-ear-to-coupler difference (RECD), REUR, REOR, and REAR. If I am going to do an advanced feature assessment, that might be under noise reduction and freestyle. A little later on, I will show you how to access speech mapping.
If you are measuring an open BTE, be sure to run the OpenREM calibration prior to your first measurement. It should come up if you have chosen open fit. You will see an OpenREM calibration dialog box. Hit start and make that measurement. This is different from the probe tube calibration and ensures that the sound coming from the speaker at the level of the patient’s ear is at the proper level.
The REUR can be used to estimate many things including the target. The best use of REUR for me is to help determine if I truly have an open fit. You want to use pink noise or something similar for this measure, and run it for about five seconds. You expect a peak on the measurement around 3000 Hz and a second peak around 6000 Hz, with a natural gain of about 12 to 18 dB. If you do not see these peaks, then you may not have the probe tube deep enough in the ear and should try to reposition the probe.
For the REOR, think back to the comparison made in Figure 4. There is a loss of output with the hearing aid in the ear, and this is definitely an occluded response. Again, use the pink noise for about five seconds.
Why is REOR important? It tells you if the ear response was altered by the placement of the domes, earmolds, or the aids. If an open fitting is your goal, then there should be very little change in the ear canal resonance between the REUR and the REOR. If an open fitting is the goal and occlusion is not present but the patient is still complaining of occlusion-like symptoms, then you may need to alter the frequency response of the hearing aid. The REOR gives you a lot of information in about 10 seconds.
The REAR should be performed with speech or speech-like stimuli, such as the International Speech Test Signal (ISTS) or International Collegium of Rehabilitative Audiology (ICRA) noise. It is your choice as to whether you want to match target, but it is a great starting point. At a minimum, you want to ensure that that speech is audible but not uncomfortable at different loudness levels. Run the REAR with a speech stimulus and look to see the frequency response of the hearing instrument with it in the ear and turned on to that particular signal.
Choosing a Stimulus
When choosing a measurement stimulus, you typically want a speech-like stimulus, such as ISTS or ICRA. You can make your selection in the software. Next to the measurement selections 1-5 shown in Figure 15, you see an arrow down. When you choose that, you can see signal types. There are many different choices there. The sequence you see in Figure 15 – soft, loud, average, and output – is a choice of test sequences. You can find many different test sequences under test selector, which you can access by pressing F8. You can decide the defaults for your clinic by choosing Set Options, and Save Options as Startup settings. The next time you come in, your chosen settings will be the default for that test. If you do not want to customize you measurements with canned tests, you do not have to.
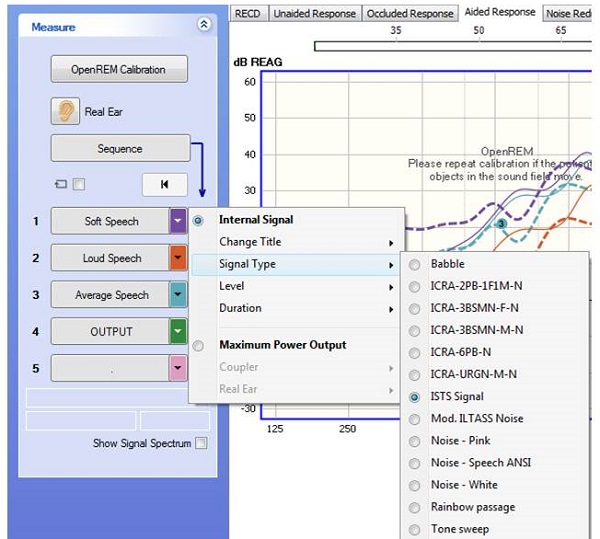
Figure 15. Screen shot for choosing a stimulus in the OTOSuite PMM.
You can only have one startup test, and if you want other customized testing options available to you later, then you would choose the icon to the left of the star under Set Options, and save those settings as a “User Test” (Figure 16). I do not have the time to go through this function step by step, but if you have questions, please call our inside audiology group and they can walk you through it.
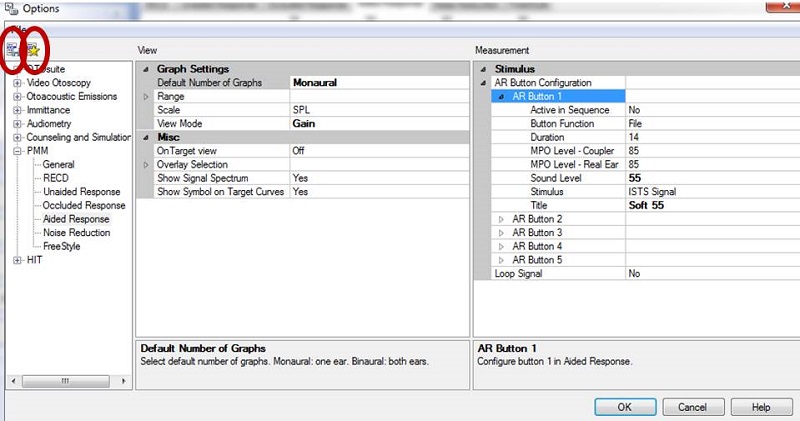
Figure 16. Set Options menu. Be sure to choose the star icon “Save Options as Startup Settings” if you want to make these settings available the next time you enter the software.
Figure 17 shows an example of a test sequence that has already been run on one ear for easy visualization. Remember that you can measure both the left and right ears simultaneously with AURICAL PMM. It takes about 45 seconds for both ears. We are looking at a gain response. The dashed lines represent the target, and in this case we chose NAL-NL2 as our target. The solid lines represent the response of the hearing instrument at the three different input levels: soft, average, and loud. The colors in the legend in the bottom right corner match the color of the curves on the graph.
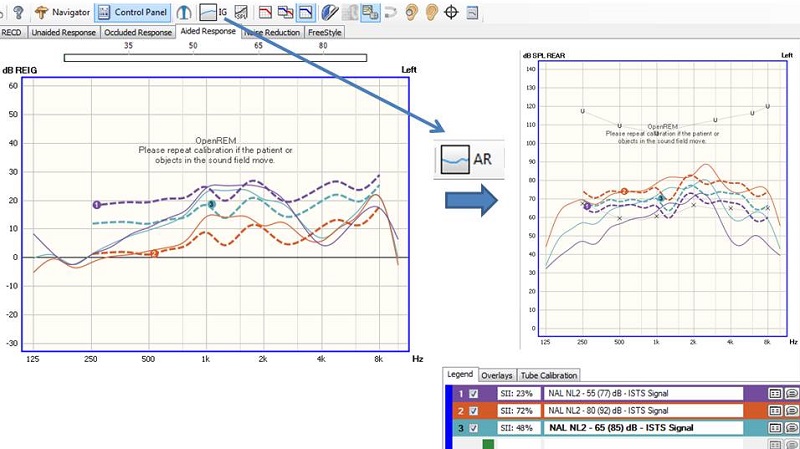
Figure 17. Screen shot of a test sequence with three input levels.
As you can see in Figure 17, the hearing instrument is not matching the target (solid line) very well in the low frequencies or the high frequencies. At this point, we should attempt to reprogram the hearing instrument to better match these targets. We can look at the aided response, REAG, or the insertion gain by choosing the button on the toolbar labeled IG (insertion gain).
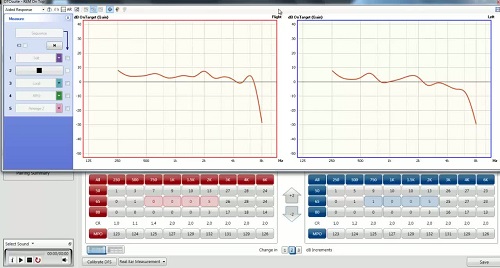
Because the response did not match target very well and we know that we need to do some reprogramming, we want to choose On Top mode. On Top mode can be accessed via the icon shown on the top of Figure 18. On the toolbar, the icon is generally somewhere to the right. When you choose this, it will bring up the REM On Top box, your manufacturer’s programming software, as well as the PMM software. In this case, we have the Connexx platform and the PMM software. If you want to make some programming changes, choose continuous loop (Figure 19) so you can see what effects the changes are having in real time as you make them. Then select the button to finalize the measurement when you have finished making your changes.
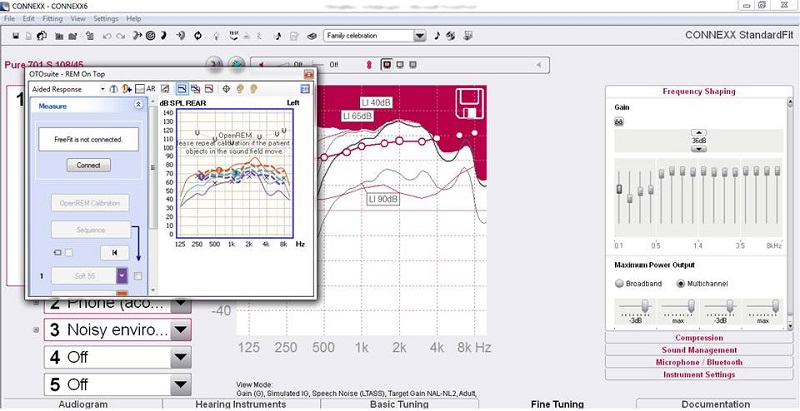
Figure 18. Screen shot of OTOSuite On Top mode. The icon to access On Top mode is shown in the top right.
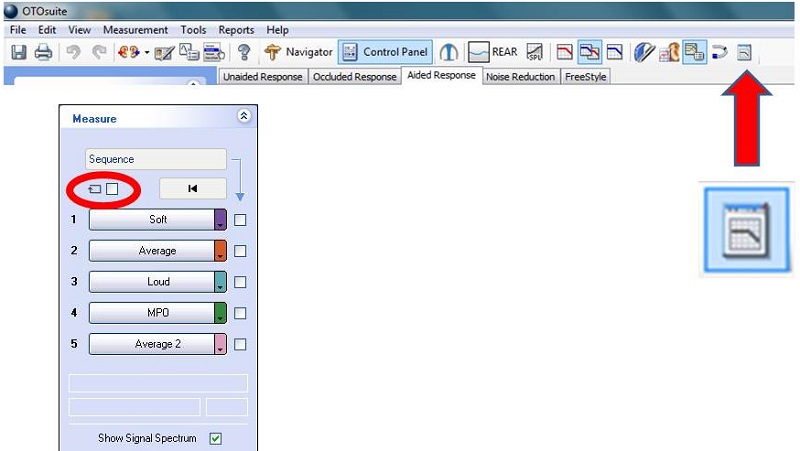
Figure 19. Continuous loop selection to make changes in real time.
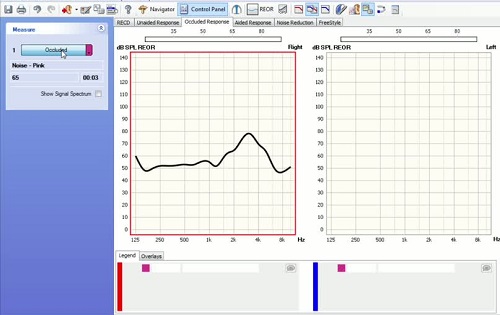
Here is another video to demonstrate that process:
Advanced Feature Assessment
Noise Reduction
Most modern hearing instruments have some type of noise reduction. How they work varies significantly from manufacturer to manufacturer. It is a good idea to demonstrate how the steady-state noise is reduced through the hearing instruments; this may be heard as well as seen on the PMM screen during the testing. This is a way to counsel your patient and verify that the noise reduction system is working and aggressive enough for the patient’s preferences. To do this, run pink noise or another steady-state signal for at least 10 to 12 seconds, ensuring the algorithm has time to make its full reduction. Figure 20 shows a hearing instrument with noise reduction set to its maximum. On the right, you can see the gain difference or the amount of reduction that was made, which was 9 dB. This would be noticeable to the patient, so make sure that they hear this and understand what they are hearing.
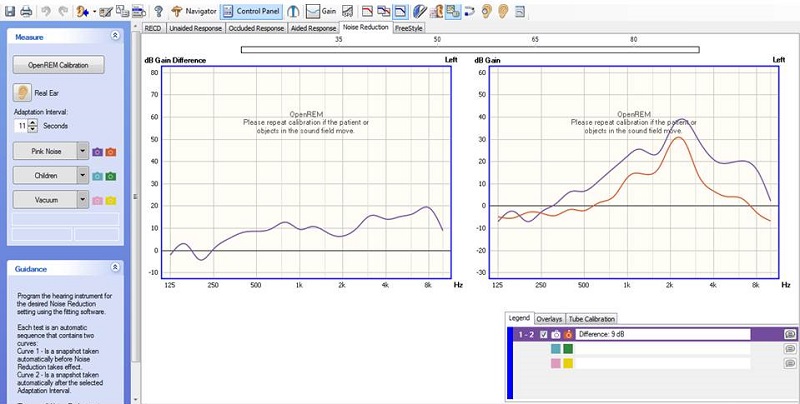
Figure 20. Demonstrating noise reduction using the PMM system. The right panel shows the reduction with noise reduction turned on (red).
FreeStyle
The FreeStyle application allows you to configure a wide variety of tests for use in demonstrating and verifying hearing aid features such as directional microphones. I will not be going through the details on how to test directional mics, but very simply, face the patient at 0 degrees azimuth in omnidirectional mode and measure. Then put the hearing aid in fixed directional mode, turn them to 180 degrees azimuth and re-measure. You should get a difference. If you do not, then perhaps directional mics are not working correctly. If you want to see this gain difference in any two measurements that you make, use the Venn diagram icon, which subtracts the differences in the responses. FreeStyle is the professional’s playground to test different instrument features.
Other Tools in PMM
On Top Mode
There are several other tools available within PMM. I have shown On Top mode, which allows using the manufacturer’s programming interface with PMM in real time. The occluded probe detector is a way to alert you if you are making measurements under poor conditions. In the Options window in PMM, choose General, then Measurement, then Misc, then Occluded Probe-Tube Detector. Select On to activate the feature or Off to deactivate it.
Listen at the Eardrum
There is also Listen at the Eardrum. Have you ever had a patient say they hear a clicking or a strange noise at the end of speech? When you listen to the hearing aid itself, you do not hear it, but it would be nice to be able to recreate it or listen at the eardrum to help the patient. This feature is available in all of the PMM test screens. You can use this functionality for patients who are hearing unwanted sounds. You can also present the client with a recorded signal or talk to the patient. You access this by clicking the Listen at the Eardrum icon. Select the ear to play and also record it.
OnTarget
Another tool is called OnTarget. It is a simple way to match target. Here is a video of this feature.
Speech Mapping
Speech mapping provides a visual display of the short-term spectrum of sounds provided by the hearing instrument in the ear. It is a visual way of looking at the audibility of sounds. For our system, at least, it is not intended to match prescribed target, but rather to ensure audibility of speech within the patient’s dynamic range. It is also used as a counseling tool.
You can get to speech mapping via the Navigator, Counseling and Simulations. You will see hearing loss simulator, hearing instrument simulator, and speech mapping. Choose speech mapping, and that will bring you into that component of PMM. Remember there are no targets in the visible speech system. A speech reference is needed to you know if you are providing audibility and can promote reasonable expectations, so you will see that the speech banana is provided as an appropriate representation of conversational speech. This speech banana is modified based on each patient’s individual audiogram and dynamic range.
The goals for speech mapping should be that soft speech is made audible, conversational speech should be audible and comfortable, and loud speech sounds loud but not uncomfortably loud. The speech mapping program is shown in Figure 21. The blue line is the signal from the hearing aid, and you can see that we are doing fine in the lows, but not doing well in the highs because the line falls outside the speech banana. We would want to adjust the hearing aid to make sure that we fall within this range. We can choose recorded signals, a CD, live speech or recorded live speech. We recommend using a calibrated signal for consistency and reliability.
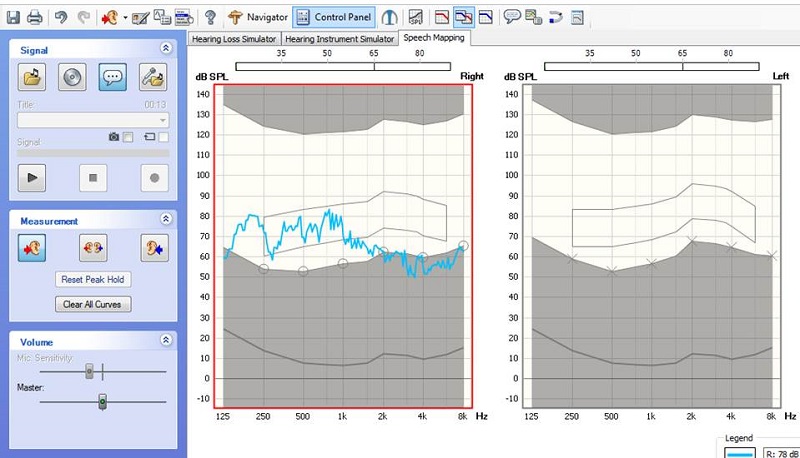
Figure 21. Screen shot of FitAssist speech mapping, where the blue line shows the measured speech signal.
Resources
Please take a moment and visit us online at www.audiologysystems.com or www.otometrics.com. If you have any questions about how to set up options, default settings or fitting protocols, we are more than happy to walk you through that. Call us at 855-283-7978. You can also find additional resources at https://www.otometrics.com/Knowledge-Center/fitting.
References
Aazh, H., & Moore, B. (2007). The value of routine real ear measurement of the gain of digital hearing aids. Journal of the American Academy of Audiology, 18(8), 653-664.
Aazh, H., Moore, B., & Prasher, D. (2012). The accuracy of matching target insertion gains with open-fit hearing aids. American Journal of Audiology, 21(2), 175-180. doi: 10.1044/1059-0889(2012/11-0008).
Cox, R. M., & Alexander, G. C. (1995). The abbreviated profile of hearing aid benefit. Ear and Hearing, 16(2), 176-186.
Dillon, H., James, A., & Ginis, J. (1997). Client Oriented Scale of Improvement (COSI) and its relationship to several other measures of benefit and satisfaction provided by hearing aids. Journal of the American Academy of Audiology, 8(1), 27-43.
Kochkin, S. (2010). MarkeTrak VIII: The impact of the hearing healthcare professional on hearing aid user success. The Hearing Review, 17(4), 12, 14, 16, 18, 23, 26-28, 30, 32, 34.
Thibodeau, L. M. (2004). Plotting beyond the audiogram to the TELEGRAM, a new assessment tool. Hearing Journal, 57(11), 46-51.
Valente, M., Abrams, H., Benson, D., Chisolm, T., Citron, D., Hampton, D., et al. (2006). Guidelines for the Audiologic Management of Adult Hearing Impairment. Audiology Today, 18(5), 1-44.
Cite this content as:
Flores, A. (2014, December). Verification & counseling of digital hearing instruments with the AURICAL PMM System. AudiologyOnline, Article 13085 Retrieved from: https://www.audiologyonline.com


