
In order to examine the range of non-technical parameters influencing a hearing aid fitting, a new questionnaire was developed and delivered to 871 users from 3 public clinics in Denmark. The aim was to investigate to what degree the following items influence hearing instrument satisfaction: expectation, motivation, social life, comfort level with the idea of having to use a hearing aid as well as actual daily usage, and instruction. The majority of questions could be answered on a 5 -point scale with anchor points on the extremes (i.e., 1 = "Not at all" to 5 = "To a very high degree"). Anchor points were changed to fit the questions as needed.
The survey revealed high overall satisfaction with hearing aids, high usage of hearing aids, and sustained social activity for more than two-thirds of the respondents. This is achieved with two or less fitting sessions for about half of the respondents. Special attention in the statistical analysis was directed to the less-satisfied users. Asked to name the experienced problems with the hearing aids, users reported "sound quality" as the problem in half of the cases. Principal component analysis (PCA) on the data material reveals correlation between factors such as expectations, daily use and instructions to overall hearing aid satisfaction.
Background
Hearing aid satisfaction depends not only on the fitting and performance of the hearing aid itself, but on other factors as well, many of which are psychosocial in nature.
A dissertation by Susanne Bisgaard (2010) recently explored these factors in Denmark and qualitatively documented their relevance. It seemed that the logical next step to this study would be to examine and quantify the findings by asking the following question: How satisfied are users with their hearing aids, and if they are not satisfied, what are the main reasons?
This article outlines the answers from a questionnaire sent out to more than 800 users of hearing aids dispensed from public clinics in Denmark. Answers indicated a generally high satisfaction and usage time with hearing aids, and that satisfaction, as expected, correlates with factors related to expectation, motivation, professional skills of the fitter, and user friendliness of the hearing instrument.
Methods
Traditional questionnaires and hearing aid inventories tend to focus on the comfort and performance with hearing aids and do not focus specifically on the psychosocial aspects. Thus, an important part of this project was to create a new questionnaire focusing on these psychosocial aspects:
- The users' expectation of the hearing aids to improve their quality of life
- The motivation, personal or from others, for the use of hearing aids
- The users' social activity level before and after acquiring hearing aids
- The users' comfort level with the daily use of a hearing aid
as well as adapting to the idea of having to use external help (i.e. "a machine") to aid hearing - Instruction and counseling, or the things professionals can do to familiarize and orient the patient with the hearing aids and to also deal with the hearing loss
Demographic Data
Demographic data (responses to questions 1 - 9) of those surveyed are summarized in Table 1.
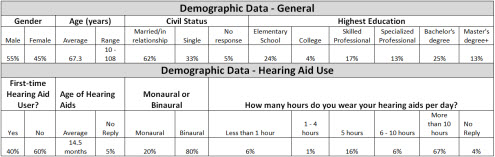
Table 1. Demographic data summarized from returned surveys (n = 375). Click Here for a larger view of Table 1 (PDF)
Results
Questionnaire and Answers
The questions included in the questionnaire have been translated to English, with the distribution of the answers for each question displayed in a percentage next to the question. Unfortunately, in many of the questionnaires the answer to one or more questions was omitted. Where the number of "no answers" influences the distribution, it is included as a part of the result. The results are grouped in the same five parameters as the questionnaire: expectation (Table 2), motivation (Table 3), social life (Table 4), and comfort level, daily use and instruction (Table 5).
Click Here to View Table 2 (PDF)
Table 2. Expectations for hearing aids. English translation of survey questions regarding expectations for hearing aids, with distribution of the answers displayed in a percentage. Where the number of "no response" influences the distribution, it is included.
Click Here to View Table 3 (PDF)
Table 3. Motivation. English translation of survey questions regarding motivation for use of hearing aids, with distribution of the answers displayed in a percentage. Where the number of "no response" influences the distribution, it is included.
Click Here to View Table 4 (PDF)
Table 4. Social Life. English translation of survey questions regarding social life, with distribution of the answers displayed in a percentage. Where the number of "no response" influences the distribution, it is included.
Click Here to View Table 5 (PDF)
Table 5. Comfort level, daily use and instruction. English translation of survey questions regarding comfort level, daily use and instruction, with distribution of the answers displayed in a percentage. Where the number of "no response" influences the distribution, it is included.
Principal Component Analysis
A Principal Component Analysis was applied to examine second-order relationships between variables. The results show the dependency between questions on the questionnaire as vectors in a coordinate system. The more parallel two vectors are, the more correlated the two answers are. The direction of the vector relates to the direction of the scale, therefore two vectors pointing directly opposite each other are negatively correlated (provided the scales are in the same direction).
The coverage of each dimension in percent shows the validity of the analysis (i.e., the higher a percentage the two dimension cover, the more relevant the correlations are). Five plots were created with Q32, Overall, how satisfied are you with your hearing aid(s)? represented in Dimension 1, with questions relating to the five factors on the questionnaire represented in Dimension 2 (Expectations, Figure 1; Motivation, Figure 2; Social Life, Figure 3; Comfort Level/Daily Use, Figure 4; Instruction, Figure 5).
For the 5 plots, Dimension 1 covers from 24-36% of the variety, and Dimension 2 from 14-22%. As the dimensions are not the same in all 5 plots, it cannot be concluded that if a question correlates with Q32 in one plot, it also correlates with other questions that correlate with Q32 in another plot.
Correlations with Primary Focus on Expectation
The results in Figure 1 indicate that Q32 correlates with Q10, To what degree can your current hearing aid compensate for your hearing problem?, and with Q11, Does your hearing aid live up to your expectations? Also, usage per day correlates somewhat with overall satisfaction. Q20, the desire to communicate, also correlates with overall satisfaction. Overall satisfaction, however, does not correlate with Q16, Have you been looking forward to begin using your new hearing aids? This suggests that the anticipation to use hearing aids does not seem to influence satisfaction.
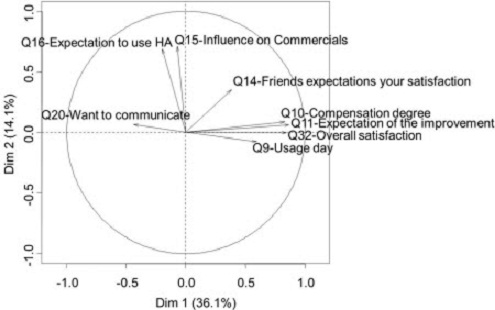
Figure 1. Correlations with primary focus on expectation.
Correlations with Primary Focus on Motivation
The results in Figure 2 indicate that overall satisfaction correlates with Q13, To what degree do you think your peers' expectation of your hearing aids has been fulfilled? It also correlates, to some degree, with the statement that using hearing aids is hard work (Q19) and with total usage per day (Q9). It is also interesting to note that peers' expectations do not seem influence overall satisfaction if the decision to use hearing aids was initiated by the user himself (Q17). The same applies to whether there was a positive bias towards using hearing aids before they were obtained (Q16). In general, very few indicated that they actively seek contact with other HA users, (Q24), and for this question, no correlation with overall satisfaction can be found.
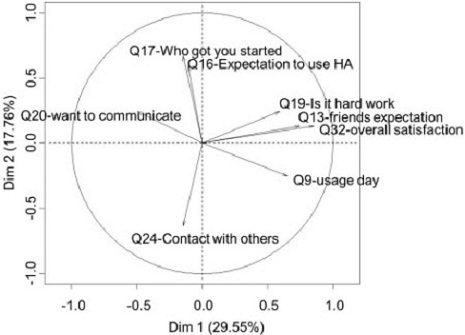
Figure 2. Correlations with a primary focus on motivation.
Correlations with a Primary Focus on Social Life
The results in Figure 3 indicate that the only correlation to overall satisfaction is Q10, To what degree can your current hearing aid(s) compensate for your hearing problems? This question has very little connection to social life issues.
When comparing satisfaction with Q22, note that the scale is reversed, showing that there is a tendency to be more socially active when hearing aid satisfaction increases. According to these results, offering counseling to friends and relatives (Q30) does not influence hearing aid satisfaction, nor does the desire for social contact with others in the same situation (Q24) correlate with satisfaction.
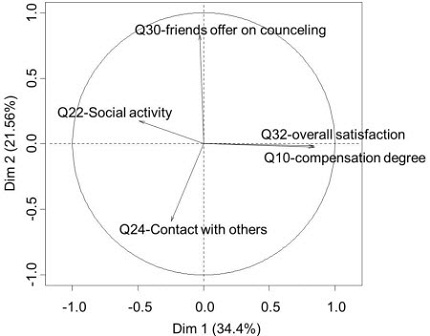
Figure 3. Correlations with a primary focus on social life.
Correlations with Primary Focus on Comfort Level and Daily Use
The results in Figure 4 indicate that no correlation exists between overall satisfaction and age of user (Q3) or how often the hearing aid is adjusted (Q28). We noted a high correlation between feeling understood by the fitter (Q31) and overall satisfaction. Furthermore, there was some indication that the easier the hearing aid is to use (Q26), the higher the overall satisfaction with the hearing aid.
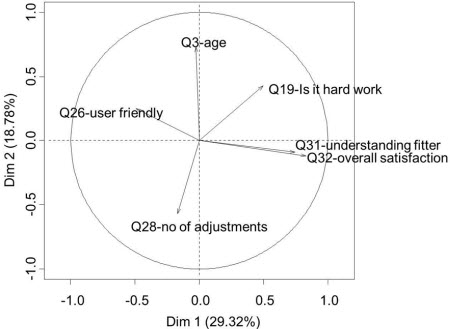
Figure 4. Correlations with a primary focus on comfort level and daily use.
Correlations With a Primary Focus on Instruction
The results in Figure 5 suggest that overall satisfaction correlates with usage time (Q9) and hearing aid age (Q7), which for the 40 % first-time users in this group, is proportional to the time they have used their hearing aid. Overall satisfaction correlates with user friendliness (Q26, reversed scale) and to a lesser degree, if HA controls are utilized (Q25a, reversed scale), and the offer of instruction (Q29). It does not seem to correlate with the age of the user (Q3) or use of controls (Q25).
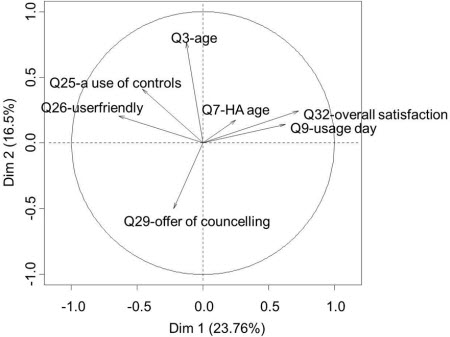
Figure 5. Correlations with a primary focus on instruction.
Discussion
Before discussion the findings of the questionnaire, a brief introduction to the Danish health care system is needed. In Denmark hearing aids can be obtained for free at one of the 17 public clinics, but typically they have to wait from 1-12 months (depending on clinic) from contacting the clinic to receiving their hearing aids. As an alternative there exists approximately 180 private dispensers where hearing aids can be obtained with a public subsidiary roughly covering the expenses to get one or two mid range hearing aids. Upgrading to high end hearing aids is then at the user's expense. The respondees of this questionnaire have all been fitted with hearing aids for free in a public clinic.
The overall findings of the questionnaire suggest that the hearing aids that users receive from public dispensers in Denmark live up to the patients' expectations. Approximately two-thirds of those surveyed look forward to the use of their hearing aids (to obtain hearing aids through public programs in Denmark, there is generally more than 6 months waiting time), and they use them once they receive them. They are satisfied with the hearing aids' performance, and they do not consider it hard work to use them. This positive picture applies to both first-time and experienced users.
Naturally, not all people transition that easily to hearing aids. Answers from questions 11 and 32 reveal that at least 10% of surveyed users were less satisfied with their hearing aids and felt that the hearing aids have not lived up to their expectations. It is the challenge of hearing aid professionals to investigate the reasons for these answers in order to help this segment of the hearing-impaired population achieve a better quality of life with hearing aids.
The Principal Component Analysis may help to shed some light on satisfaction and dissatisfaction. Generally, this analysis shows a number of expected correlations between overall satisfaction and hearing aid use, fitter empathy, expectation of improvement with hearing aids, and acknowledgement of the fact that using a hearing aid is hard work.
More interesting, perhaps are the factors which do not seem to correlate to satisfaction. These are: age of user, consultancy or counseling, whether the initiative to pursue hearing aids was from self or others, and whether the user is looking forward to getting hearing aids. Additionally, 80% claim that advertising or commercials have no influence on their expectations. In other words, results from this investigation suggest that satisfaction with hearing aids has nothing to do with age and who proposed the use of hearing aids, but has everything to do with the fitter's skills, accepting the challenge of hearing aid use, and believing that a hearing aid will compensate for the hearing loss.
Some expected correlations could not be shown in the statistical analysis, such as the importance of counseling and the influence from commercials. Unfortunately, it is hard to tell if these "missing correlations" are caused by the design of the questionnaire, a difference in the population answering the questionnaire versus the general population, or simply because the respondents didn't want to admit the influence.
Acknowledgements
The article is based upon the master thesis work of Technical Audiologists Derya Ceylan and Wiebke Hudemann (Ceylan & Hudemann, 2011).
References
Bisgaard, S. (2010). Coping with emergent hearing loss, expectations and experiences of new, adult hearing aid users: an anthropological study in Denmark. Johann Wolfgang Goethe-Universität Frankfurt am Main, Sprach- und Kulturwissenschaften.
Ceylan, D., & Hudemann, W. (2011). A questionnaire: satisfaction by using hearing aids- according to the psychosocial aspects expectations, motivation, social life, getting use to and instruction. Masters Thesis, Southern University of Denmark, Faculty of Humanities.