Editor’s Note: This text course is an edited transcript of a live webinar. Download supplemental course materials.
The title of this course, Making Speech More Distinct, is specifically targeted towards the most difficult issue for patients with sensorineural hearing loss, which is speech understanding in complex or difficult listening environments. As you know, the approach we normally take in our field is to do something to decrease the amount of noise, either by using directional microphones, noise reduction strategies, or FM technology. The approach is to somehow get the noise out of the way so the person can hear speech. The other side of the equation that has not received as much attention is to make the speech signal more distinct. In other words, instead of trying to make the noise go away, we try to make the speech stand out more. That is another way to possibly address this issue, but as you will see from this course, it is a more difficult process than it sounds.
Today’s agenda will proceed as follows. First, we will review the nature of speech understanding. Then we will talk about the acoustics of speech in real conversation, not just in sterile environments. We will talk about the example of naturally produced, enhanced speech and use that as the gold standard when comparing other approaches. We will talk about what it will take for computer-based speech enhancement to work. Lastly, we will look at past examples where these approaches have been attempted, and then I will make a few comments about what the future holds in this area of technology.
The Nature of Speech Understanding
We are going to start with a simple graph that explains how we approach improving speech understanding for patients with sensorineural hearing loss (Figure 1). This is the speech importance function from the Articulation Index (AI) or the Speech Intelligibility Index (SII) that plots the relative importance of different frequency regions for speech understanding. I looked at some text books on speech acoustics and identified the frequency regions where different acoustic contrasts occur in English. The idea was to map out where the different cues in speech occur in a frequency region, especially the most important cues for speech understanding. When you do this, you get a quick understanding of why the speech importance function looks as it does. There are many contrasts in the speech signal that occur above 1000 Hz and out to approximately 4000 Hz. Look at all of the different classes of phonemic information contrasted in the 1500 Hz to 4000 Hz range (Figure 1). It is clear to see the importance of the mid to high frequencies.
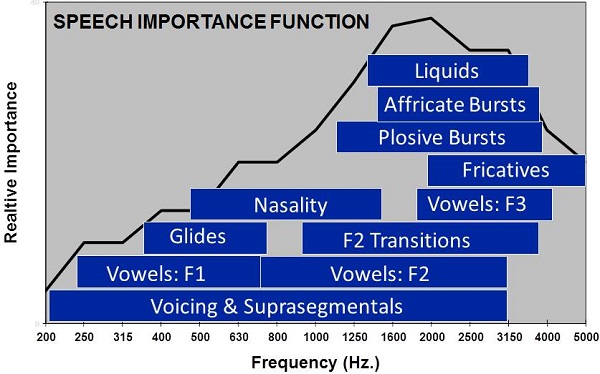
Figure 1. Speech importance function, with phoneme contrasts according to frequency range overlaid.
We use a speech-on-the audiogram approach to explain hearing loss to patients. There are many advantages to using this to explain communication. It breaks down speech into simple contrasts that patients can understand. I have made a slightly different version that uses only the place differences for the unvoiced plosives /p/, /t/, and /k/ and the voiceless fricatives /th/, /h/, /s/, /f/, and /sh/, and, just by contrast, some of the second-formant vowels as seen on the bottom of the blue speech banana (Figure 2). When you are looking at specific contrasts in a speech signal, for example, “She said give me a kiss,” or “See Fred give me a fish,” you can point to the acoustic regions where those contrasts occur. There are frequency differences between these phonemes, but there is also a lot of overlap between these phonemes. Very precise frequency resolution is essential.
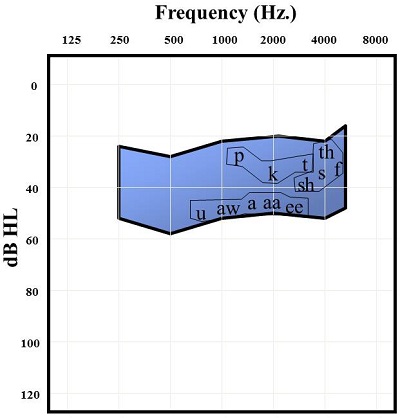
Figure 2. Audiogram comparing unvoiced plosives, voiceless fricatives and second-formant vowels.
Another issue is that of natural intensity level differences between the phonemes. For example, /sh/ is naturally more intense than a voiceless /th/. The difference between those phonemes is not only frequency region, but it also intensity level. That is precise information. One of the first things to recognize when attempting to enhance speech is where this information falls in the frequency and amplitude regions, and then making sure that those contrasts are maintained. There are many acoustic aspects that differentiate these most important phonemes aside from frequency. There can also be durational and dynamic differences, which is how the sound naturally changes shape over time when it is coming out of the mouth. When you account for all of those factors, you start to see how selecting and enhancing speech becomes problematic.
Speech is a very complex waveform. There are many different dimensions on which two phonemes can contrast, and if the focus comes on one particular domain, such as frequency, and the comprehensive description and differences of a phoneme are excluded, then the idea of enhancing the speech signal to make a particular phoneme stand out more becomes much more of a challenge.
In Figure 3, you can see the spectrogram of the phrase, “ages sixty to sixty-five.” It has been band passed in both the low and high frequencies. I like this particular depiction because it contrasts the major energy portion of the vowels (blue) from the higher frequencies (red), especially the unvoiced consonants. It is important to recognize that vowels have energy, not just in the low frequencies, but in the high frequencies as well. Information above 1500 Hz is important to the vowels, because that is where the second and third formants occur, and knowing the position of the second and third formants becomes important in order to differentiate vowels from each other.
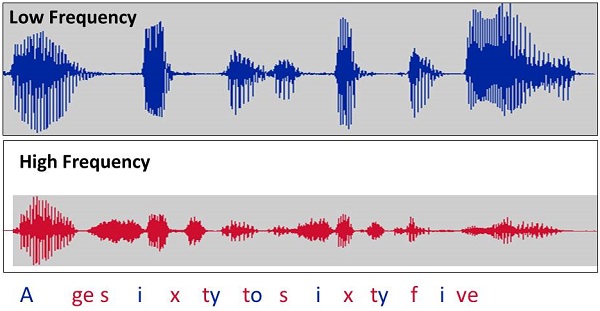
Figure 3. Low-frequency inputs versus high-frequency inputs in the phrase, “ages sixty to sixty-five.” Blue= low frequency; Red= high frequency.
I believe that the frequency cutoff between the low and high frequencies in Figure 3 is 1500 Hz. Not only is the intensity lower in the high frequencies naturally, but the timing and the duration in the high frequencies tends to be quicker and shorter, meaning that the high-frequency consonants are often much shorter in duration than the low-frequency-dominated vowels. That becomes something to consider when you start talking about speech enhancement. These are the softest, fastest, and most subtle sounds that are produced, but they are also some of the most important sounds for speech understanding. The unvoiced fricatives and the unvoiced stops are probably the most “fragile” sounds because they are weak, and they are very difficult to have a computer algorithm find and enhance. We will get more into that as we continue.
Dynamic-Based Contrasts
As I said earlier, you have to account for some of the dynamic-based contrasts in speech. Think about the differences between fricatives and affricates, for example, /sh/ versus /ch/. The phoneme /ch/ occurs in the same frequency region because the frication part of the affricate is the same as /sh/. In /sh/ versus /ch/, the difference is primarily a dynamic change. In the affricate /ch/, you close off the mouth as you would with a stop, and then you rapidly open it up into a fricative-like sound. In that case, you have a change in the consonant sound. To make /ch/ more perceptible, you have to account for the fact that part of the natural structure of a /ch/ is silence. You close up, build the pressure, and then you release it. It is tricky to enhance silence, but if you do not have the silence there, you lose part of the form of the sound. That is why the dynamics become one of the things that must be considered.
The next dynamic-based contrast is plosive versus fricative, for example, /d/ versus /z/. These are two voiced consonants, both produced at the same place in the mouth, but the difference is that the /z/ is a continuant, meaning that you can choose how long to continue the sound. It is a voiced fricative, and /d/ is a stop. Those two sounds are produced in the same part of the mouth and have similar frequency characteristics, but it is how those frequency characteristics change over time that matter. There is also going to be some intensity changes over time that you have to consider.
Next we have diphthongs versus vowels. Diphthongs are two different vowels combined together, such as /oi/. It is a little more complex than that, but the idea is that you have two different vowel-like sounds, and there is a transition from one to the other. It is not a steady-state vowel.
Lastly, there are consonant-vowel and vowel-consonant transitions. It turns out that these transitions carry a tremendous amount of information. Individuals with sensorineural hearing loss who have trouble with the perception of consonants, especially high-frequency unvoiced consonants, can still glean a lot of information about a consonant based on the transition, either from the vowel preceding that consonant or a vowel following that consonant. Even though the consonant itself might be hard to hear, you get context clues about the place of that consonant based on this vowel transition. As the mouth is changing position and creating a sound going either into or out of the vowel, you get information about the place of that consonant.
Let’s look at this again graphically (Figure 4). This is an example of a fricative versus affricate in the phrase “why chew my shoe.” I set up this sentence because I wanted to show the same vowel before and after the consonant, but also to contrast the dynamic properties between the affricate /ch/ and the fricative /sh/. Figure 5 is a closer look at the envelope of the onset of those two sounds. With the affricative /ch/, you have the closure phase, so you have the silence and then you have the rapid release into the high-frequency frication. Whereas with the /sh/ fricative, you get a more gradual build-up of that high frequency amplitude. You have two sounds that are approximately the same total duration, but it is the change in level over time that defines the difference between these two contrasts. That is a very good example of something that would be hard to enhance with some sort of automatic routine.
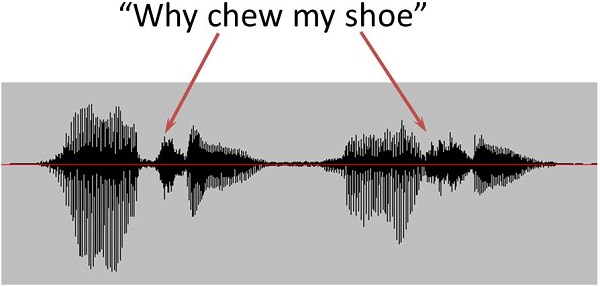
Figure 4. Spectrogram of the phrase “why chew my shoe,” demonstrating the affricate /ch/ and the fricative /sh/.
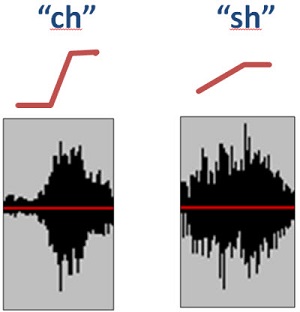
Figure 5. Envelope of onset for /ch/ (left) and /sh/ (right).
Figure 6 is a comparison of two consonant-vowel transitions for “pool” and “tool.” The burst release of the /t/ is at a higher frequency than that of the /p/. If the person has high-frequency hearing loss and has trouble hearing or differentiating the /t/ or even the /p/, the second major cue of the place difference would be the robust transition out of the consonant burst release into the steady-state vowel. That is driven by the second formant (F2) and that provides a lot of spectral information. The second formant of speech turns out to be one of the most information-rich parts of the speech signal. When I received my PhD, I was at Louisiana State University in Baton Rouge. My department chair at the time, Ray Daniloff, pointed out that the second formant is basically a map of where the tongue is in the mouth. The better you can resolve the second formant, the better you know what is happening with the tongue, which is the primary human articulator.
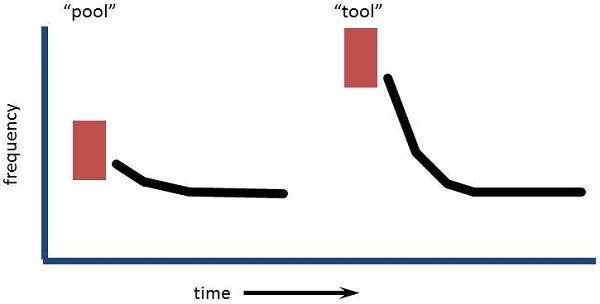
Figure 6. Consonant-vowel transition of the second formant in “pool” versus “tool.”
The Acoustics of Speech in Conversation
If speech enhancement strategies are to have any impact for a person with sensorineural hearing loss, they have to have an impact on real speech in real environments. It is one thing to have a speech enhancement routine that works well on isolated phonemes in a sterile environment, but unless this technology has been proven to work well in a realistic communication environment, it does not do anyone any good. One thing to remember is that speech is movement. I think the example I gave regarding the movement of the tongue as an articulator and the second formant is a good example. Speech comes from the body; it is air blown out of the mouth, and the path of that air is changed as you move your articulators to create different patterns of sound.
It is important to reflect on how much you move your articulators when you speak. Movement from phoneme to phoneme to phoneme over time is coded in the acoustic signal. If you want to know how complex the speech signal is, pay attention to how complex the lips, tongue and jaw movements are when you move your mouth.
Speech is produced as a complex, flowing waveform; it is not a sterile, piece-by-piece puzzle. That has to be accounted for when you think about what it takes to enhance speech. Say the word “slipknot” to yourself. That one word takes a half of second to produce, and there are probably a dozen movements completed by your articulators. For example, the one transition from the closure of the /p/ to the release phase of the /n/ requires dropping the velum to allow the nasality to occur and the unpursing of the lips. Because each sound has a complex series of movements and you do not move instantaneously from one mouth position to the next, it is all a matter of transition.
Figure 7 shows the spectrogram of “two weeks later.” Along the Y-axis is frequency; this spectrogram goes up to 10 kHz. The X-axis is time in milliseconds. The brightness of the color indicates the intensity of the sound. White is the most intense, followed by yellow, orange, red, purple, and the least intense is blue. Most of the movement you see in Figure 7 is the second formant. The dramatic movements of the second formant are down around 2000 Hz. You also see some third formant movement around 7000 Hz. You can easily see the closure phase in the /k/ marked by the absence of most sound at 0.45 ms. You see the frication of the /s/ at the end of “weeks.” You see the very brief closure phase for the second /t/, but it is there, and all that reflects very precise movement in an ongoing signal.
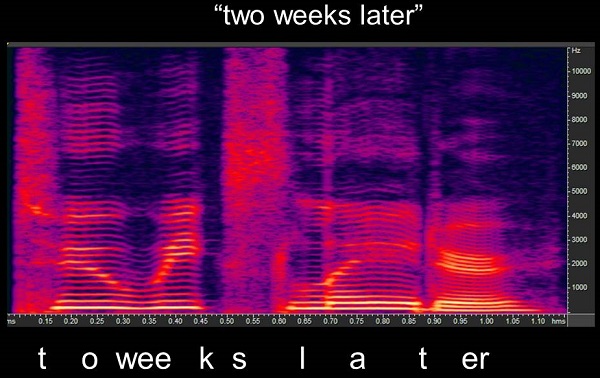
Figure 7. Spectrogram of the phrase “two weeks later.”
Figure 8 is the one-syllable word “change” in a spectrogram. I included this waveform to show that the vowel /a/ changes over time. This idea that vowels have a steady-state portion is a misnomer. Unless you are singing, you typically do not hold one tongue position, even when you are producing a vowel. Usually you move the tongue into its target position, and typically, you do not even reach the target before you start transitioning to something else. In this case, the level that changes over time is a reflection of the fact that you never stop at one precise place to produce a vowel sound. It is a hint at a steady-state sound, but it is more of a transition into it and back out of it. That will show up in the waveform of speech also.
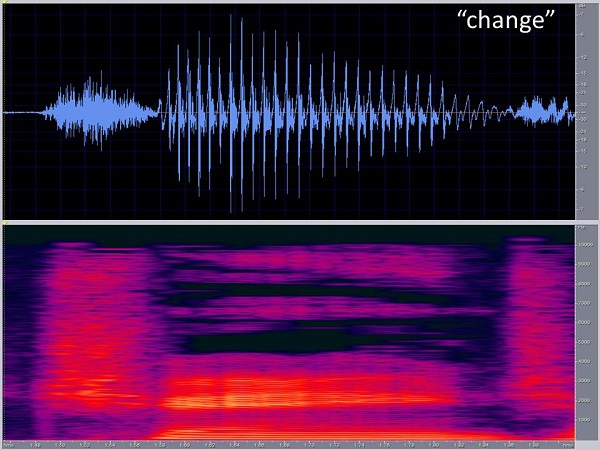
Figure 8. Spectrogram of the word “change.”
How do we talk? We provide minimal effort. One of the principles of human survival is conservation of energy. For example, I spent all morning recording podcast material, and on something like that, you want to produce very clear, distinct speech; I became exhausted. I was recording for about an hour and a half, and putting out quality, clear speech becomes very difficult over an extended period of time. Humans are not used to doing that. We talk in a conversational technique with minimal contrasts and durations; we speak just well enough to be understood. We tend not to produce speech in its “fully-formed” version. We are only as clear as we need to be, and we adjust to the environment. When the noise level goes up, we will raise our voice and maybe slow our voice a little. However, when a person speaks, they normally assume that the person to which they are speaking has normal hearing. There are special cases, of course. Most audiologists talk differently when they are fitting a hearing aid or doing a hearing test to someone they know has hearing loss than they do when talking with their family members. They know they have to go into clear speech mode when they are talking to someone with hearing loss. When you assume your conversational partner has normal hearing, you typically do not put that much effort into producing speech. However, people with hearing loss have many conversations with people who do not know that that person has a hearing loss. So the speech received by people with hearing loss is often produced by someone who is not putting in any extra effort.
Speaker-to-Speaker Variability
No two speakers produce sounds the same way. For example, Figure 9 is the phoneme /i/ (“eee”) produced by four different talkers. The first column is as close to the steady state as I was able to find by four different talkers. I want you to look up in the high frequencies on the x-axis; this is where the F2/F3 combination occurs. /i/ has a high second formant. The morphology of those formants is different for all four talkers, even though it is easy to identify that they are the same phoneme. The right-hand column of Figure 9 is a second production of /i/ from the same four talkers, but now they are out of order. If you were to play “Match the Phonemes,” you could easily match the talkers’ productions of /i/. There is a good amount of consistency from production to production within a talker, but between talkers, there is considerable variability. Another challenge of speech enhancement is to deal with the natural variability from one talker to another.
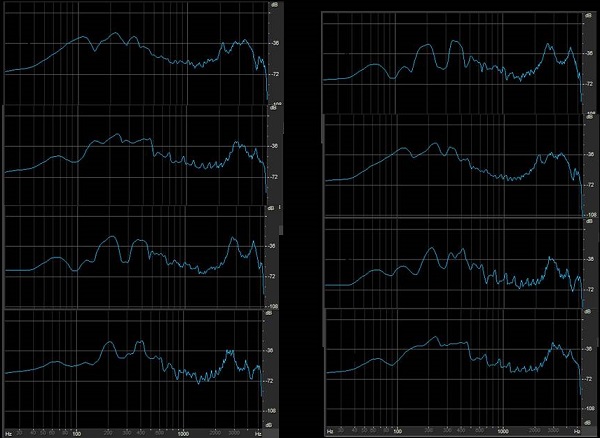
Figure 9. Two spoken productions (left and right columns) of the phoneme /i/ by four different talkers, arranged randomly in each column.
When patients with sensorineural hearing loss talk about difficulty understanding speech, they are typically talking about having difficulty understanding speech when the competition is other people talking. That is a simple reality that our field has to start admitting. The idea that speech-shaped noise means anything to a listener is inane. When people talk about having trouble in noise, they are talking about having trouble with other people talking. When that is the case, you have to find solutions to solve that problem.
Figure 10 shows waveforms from two different talkers. There are about three sentences from each of them. At any moment in time, if you mix those two voices together, you will have phonemes occurring from two different talkers that occupy similar frequency regions (Figure 11). They can come in at similar intensity levels. A speech enhancement algorithm would have to know which phonemes you want to enhance and which ones to skip. You only want to enhance the ones from the target speech. Of course, that is a nearly impossible sort of task.
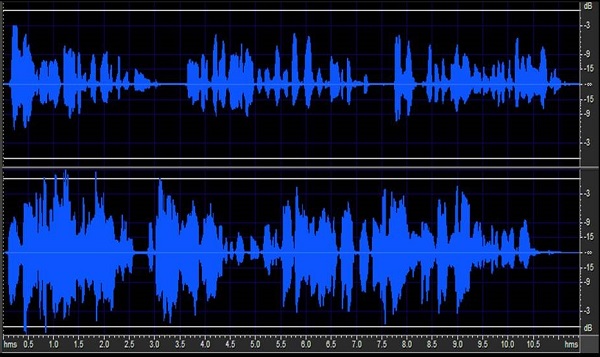
Figure 10. Differing speech waveforms from two talkers.
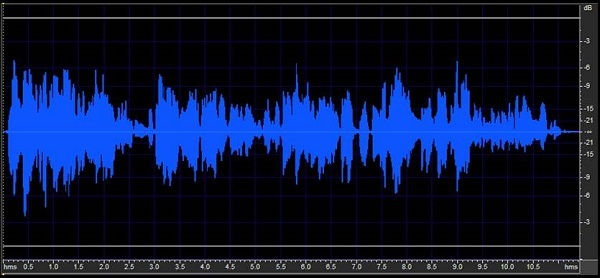
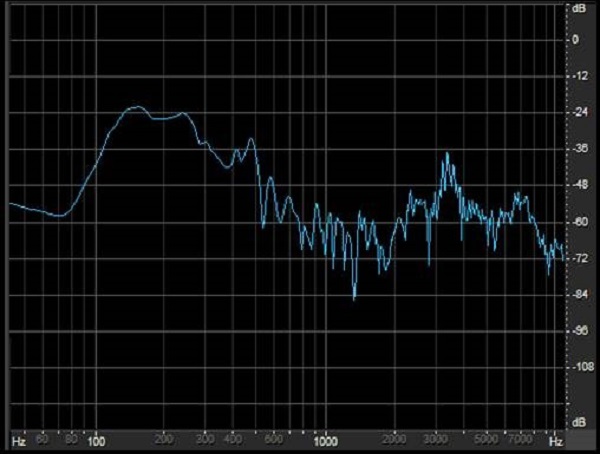
Figure 11. Combined speech waveforms from Figure 10 represented over time (top) and by overall frequency (bottom).
If I focus in on one particular moment in time where /s/ was being produced from that combined signal of two different talkers (Figure 11), you can see the /s/ being produced in the high frequencies. There is no way by merely identifying it as /s/ to know whether or not that /s/ came from the talker on which I want to be focusing. This is going to be the greatest challenge of any automatic speech enhancement routine - being able to differentiate a target talker from a non-target talker. That is going to be the most challenging environment for a patient where they are looking for the most help.
Naturally-Produced Enhanced Speech
I want to talk about naturally-produced enhanced speech, which would be the gold standard. A talker can make themselves clearer using a technique called clear speech. If humans can do that naturally and do it well, then that should be viewed as the gold standard for an automatic technique to try to do the same thing.
Clear speech is defined as the natural acoustic changes which occur when a talker attempts to produce speech which is precise and accurate. The original work on clear speech was done by Michael Picheny, Nathaniel Durlach and Louis Braida (1985) at MIT, where they identified a phenomenon that when a person knows that they are talking to a hearing-impaired individual, they shift into a different speaking style that creates a more distinct acoustic signature to the speech signal. They were able to demonstrate that if you shift into this clear speech mode, your speech is truly more intelligible to a person with hearing loss. In my mind, it was one of the most important papers in our field on speech understanding of the hearing impaired. It laid out the challenges that we run into. Speech can be made more distinct for a person, and it can be done naturally. It is certainly not a simple task from a computer standpoint, however.
Picheny et al. (1985) documented both specific acoustic changes and intelligibility improvements, and then they followed up with a series of other projects where they examined these effects in detail. Clear speech is a slower rate of speech, but it is not slow speech. When you tell a person to slow down, they typically stretch out their vowels. However, patients with hearing impairment do not have problems with vowels, but with consonants. Simply stretching out the vowels does not make much difference. If you use a slower rate of speech, there is a natural change that occurs when you try to produce clear speech. There are more frequent and longer pauses between words and phrases. You get longer phoneme durations for both vowels and consonants. Those durations naturally can be very brief, and they can be very hard for a person with hearing loss to resolve. At the end of sentences, we tend to swallow stops. If I say the word “cat,” I will not typically produce the plosive burst “t” at the end. When you go into a clear speech mode, however, you are more likely to say “ca-t” and release the final stop /t/, because it carries more information about what you just said.
There is greater differentiation of vowels, meaning that the vowel space becomes larger; I will show you what I mean by that in a minute. Very importantly, you also improve the consonant-to-vowel ratio. As you know, vowels are naturally more intense than consonants, and you will never get to the point where your consonants are more intense than the vowels, but you minimize the difference. You bring up the intensity of the consonants in relation to the vowels so that you have a fighting chance of being able to perceive the consonants.
Figure 12 is an example of clear speech versus conversational speech. “Tuborg is a famous Danish beer. So is Carlsberg.” The speech on the left side was produced in a conversational style and the speech on the right side was produced in a clear style. What you see is that the total duration is longer and the overall intensity is higher for clear speech than for conversational speech. However, clear speech is not loud speech. Because you produce steady-state portions more often in clear speech, you naturally build up more volume to the speech. Pauses tend to be more frequent and longer between words and phrases. Lastly, the longer, more intense consonants leads to an improved consonant-to-vowel ratio.
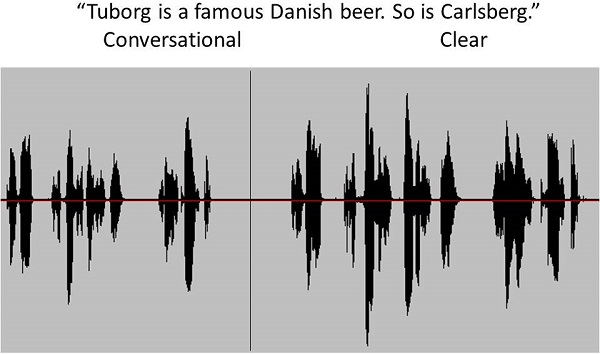
Figure 12. Comparison of conversational (left) and clear speech (right).
I mentioned that the vowel spacing gets bigger. There is a natural relationship between the first formant and the second formant; think of it as a map inside the mouth. The three points of the classic vowel triangle in the mouth are the low center vowel /ae/, the high, back vowel /u/, and the high, front vowel /i/. When using clear speech, you get closer to achieving these target positions. You do not fully produce vowels the way you would do in isolation when you are engaged in conversational speech, but when you shift to clear speech, you get closer to the optimal position of the tongue for the vowel. You create a greater contrast between the first formant and the second formant because you are moving your tongue into the full position where it would occur. In conversational speech, you are moving too quickly to hit the target precisely each and every time.
The intelligibility effect of clear speech has been studied by many researchers over the years. If you compare a hearing impaired person’s ability to understand conversational speech versus clear speech, the average improvement is between 15% and 20%. That is similar to the effect that someone would get from directional microphones in a realistic environment. That makes a lot of difference for people.
In 1996, I examined a group of 20 inexperienced talkers: half were elderly and half were young. They all had fairly decent hearing. I gave them about 5 to 10 minutes of training and practice on clear speech, and then I played their spoken material back to a group of individuals with hearing impairment. I was interested in seeing how many different people I could train in clear speech. It turns out that almost all of them were trainable.
Figure 13 is the word recognition improvement (in RAU) when listening to clear speech. RAU (Rationalized Arcsign Units) is very close to percent correct, but it adjusts for the very low levels and the very high levels. So, this graph shows the improvement in essentially percent correct across the young talkers and the elderly talkers. There is some variability, but, on average, the improvement in this study was around 19%.
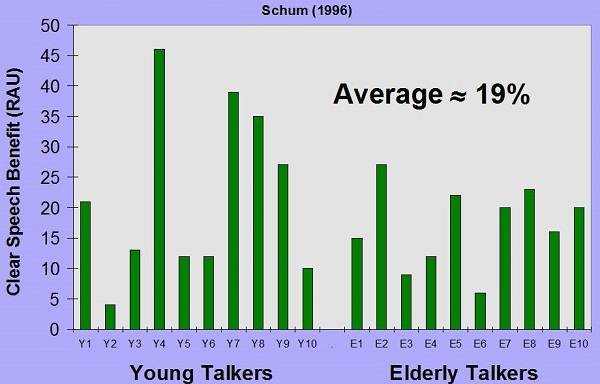
Figure 13. Word recognition improvement in elderly and young participants.
I did an acoustic analysis of the conversational and clear speech to make sure that it was similar to what Picheny and his colleagues (1985) were able to find. For example, Figure 14 shows the percentage of word-final stops released for the young and the elderly talkers; conversational speech is in blue and clear speech is in red. You can see a significant improvement in the percentage of time that the word-final stop is released for clear speech over conversational speech. That is one of the acoustic markers.
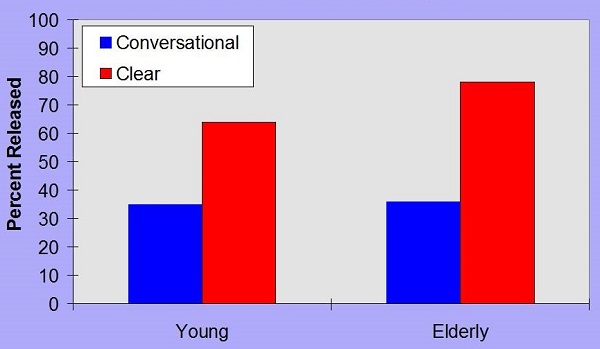
Figure 14. Released word-final stops for conversational (blue) and clear speech (red).
Figure 15 shows the voiced fricative consonant-vowel ratio. Again, in consonant-vowel ratios, the vowel is always going to be higher than the consonant, but you can make that difference smaller. You see an improvement of a couple dB with clear speech, sometimes a little bit more in terms of the consonant-vowel ratio.
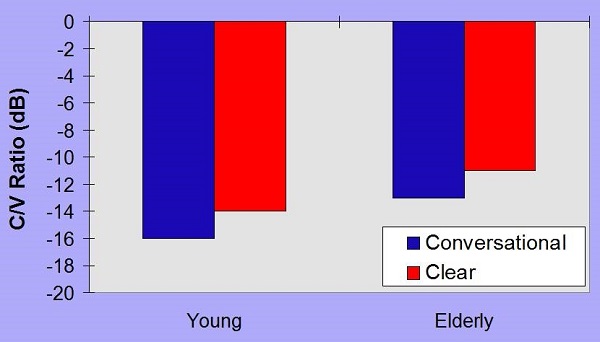
Figure 15. Voiced fricative consonant-vowel ratio comparison in dB for conversational (blue) and clear speech (red).
Another indication of an acoustic change with clear speech takes place with the vowel space. Figure 16 depicts the vowel space on average for the elderly talkers, with conversational speech in blue and clear speech in red. Again, we have /ae/, /u/, and /i/ as the triangle points. On average, those points are closer to each other in conversational speech, but in clear speech, they get farther apart. The difference is especially apparent on the second formant. That high second formant jumps out more in the /i/ vowel in the clear speech than it does in conversational speech.
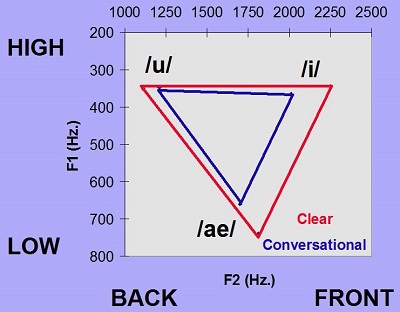
Figure 16. Vowel comparisons between conversational speech (blue) and clear speech (red) for elderly listeners.
Data from the MIT group, Payton, Uchanski, and Braida (1994), was published as a follow-up study on clear speech. They looked at the clear speech benefit across different environments, from easy, anechoic situations to difficult environments with moderate level of noise plus reverberation, for two different talkers. The benefit between clear and conversational speech is greater as the situation gets more difficult. In other words, clear speech can make the greatest difference in environments where you need help the most than in less difficult environments. That is important because as you move to more difficult environments, automatic speech enhancement approaches run into the most trouble.
Requirements for Computer Enhancement
If you were going to somehow build an automatic system to make speech clearer, what would it take to do that? First, you need an automatic speech recognition engine. This must be able to identify speech and the specific phonemes in speech as the signal. Automatic speech recognition must be accurate. It has to accurately identify the phonemes that you want to enhance, but it also has to be robust, meaning that it has to work at relatively poor signal-to-noise ratios. Those two requirements are very difficult.
Automatic Speech Recognition
How good is automatic speech recognition? I am going to give you the opportunity to listen to some samples. You are going to hear my reading of some Hearing in Noise Test (HINT) sentences at different signal-to-noise ratios. Note at what signal-to-noise ratio you feel that you are getting most of the information.
Here is what you are listening to:
0 dB SNR: The boy fell from the window. The wife helped her husband. Big dogs can be dangerous.
+5 dB SNR: Her shoes were very dirty. The player lost a shoe.
+10 dB SNR: Somebody stole the money. The fire was very hot.
+15 dB SNR: She's drinking from her own cup. The picture came from a book.
+20 dB SNR: The car was going too fast.
Most people with normal hearing feel that they are doing fairly well at 0 dB signal-to-noise ratio. I took that same recording that you just heard and played it to Dragon Naturally Speaking, which is the most popular automatic speech recognition system in the marketplace. Many people use it to dictate to their computers, and it gets better the more it “hears” one speaker’s voice.
At +5 dB signal-to-noise ratio with a voice that Dragon knew pretty well, some sentences were close and others were far off (Figure 17). At that signal to noise ratio, the system was struggling. Most people with normal hearing would say that speech is very intelligible at +5 dB signal-to-noise ratio. The point is that automatic speech recognition, at least the way it is available in the marketplace, still has a long way to go. In fact, Figure 18 shows the data for the sentences where I played the sentences in quiet to Dragon Naturally Speaking. It gets most of it right, but not all of it, even in quiet.
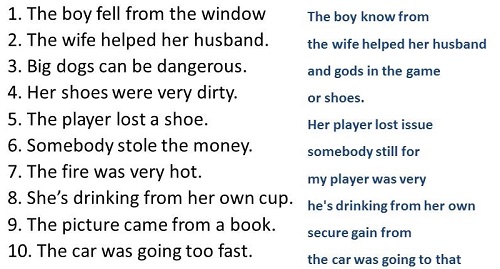
Figure 17. Dragon Naturally Speaking interpretation (blue) when played recorded HINT sentences at a +5 dB signal-to-noise ratio.

Figure 18. Dragon Naturally Speaking interpretation (blue) when played recorded HINT sentences at a 0 dB signal-to-noise ratio
We have some data from Davis (2002) on speech recognition engines similar to Dragon Naturally Speaking. When it is trained to a voice, the maximum performance is around 80% at very good signal-to-noise ratios (e.g. +25 dB). Remember that a normal-hearing person can be at 100% around 0 to +5 dB signal-to-noise ratio. The point here is that automatic speech recognition is not getting us very far.
A recent book (Pieraccini, 2012) on automatic speech recognition gives error rates from 1988 to 2010 for different types of speech from different studies. If you had a human listen to a signal and write down the speech, there is a transcription error range that is considered normal, as humans will make mistakes when recalling what they heard. The error rates for automatic software systems have come down to close to 10%. A few studies show error rates that are a bit better, but most authors in the subject area would agree that the error rates are still above that of what a human transcriber would do. All this data is obtained under good listening conditions without a signal-to-noise ratio challenge. Even in quiet, these speech recognition engines have a ways to go.
System Requirements of Automatic Speech Recognition
The other big challenge to making an automatic algorithm is that it has to be able to distinguish the signal in real time. If you are going to build this into a hearing aid to allow better speech understanding, it has to happen in real time because time, and conversation, marches on. You cannot have a speech enhancement routine with a delay. As you are listening to a talker, you are also watching their lips move, and you cannot have a several second delay in whatever enhancement is going on or the speech will not match the lips.
Another challenge of automatic speech recognition systems is that they are not very fast. There are oftentimes delays built in. Those delays would be very disruptive to any sort of algorithm. The basic challenge is that they are not very accurate, and they are certainly not very accurate in poor signal-to-noise ratios; they cannot keep up.
The other requirement is that the system has to have some sort of enhancement scheme where it addresses a lot of different acoustic properties of speech. It is not just making S’s or T’s more distinct; there are many different phonemes that have to be dealt with. These are not simple frequency or amplitude differences, but very complex waveforms with very complex dynamic behavior of these phonemes. If you want to enhance them, you have to be able to deal with multiple dimensions at the same time.
In my study on clear speech (1996), I ran individual correlations between 15 different acoustic variables under three conditions: clear speech, conversational speech, and the difference between clear and conversational speech. I was looking to see if there was any particular acoustic marker that was of greater importance than the others. The best single correlation I found was 0.45, which was not very high. That only explains about 20% of the variance. There is no one single acoustic marker that determines what clear speech should look like, but what I found was that a stepwise analysis drove correlations up above 0.9, which are very good correlations. In order to do that, however, I needed 9 or 10 different acoustic dimensions. This is not just a statistical sort of exercise. It tells you that in order to go from conversational to clear speech and make speech more distinct for a listener, you have to change many precise acoustic dimensions in the signal.
A lot of the automatic speech recognition approaches or speech enhancement routines that have been referred to in the past are very narrowly focused on making voiceless fricatives more intense or making stop bursts more intense. There is only so much that you are going to get out of that. If you want to go to a truly enhanced speech signal, you have to deal with multiple dimensions at the same time.
The other issue that these approaches have had in the past is the naturalness effect. When you go in and artificially enhance very individual parts of the acoustic signal, you can create a very unnatural sound quality. I refer to it as the “Avatar Effect.” If you have ever noticed in a video game or computer-generated movie, the animations are always a little off and unnatural. There is something about the quality where you know it is not really a human moving. It is very difficult to get all the subtleties of movement in an animation. For example, when you walk, the number of precise changes that your body makes to keep you in balance and moving forward affects many different muscle groups in your body. One of the challenges with animations is getting those to look natural.
This is the same thing with speech enhancement. If you focus on only a couple of different acoustic elements to enhance, you end up creating an unnatural sound quality because you are not accounting for the fact that speech is movement - the complex movement of the articulators in the mouth. If you do not account for all the subtleties of movement the mouth could create, then the whole acoustic signal ends up sounding odd to the listener.
Past Examples
I would like to finish with a couple of examples that have been done in the past. Although it has been attempted, no one has come up with a good speech enhancement system that works outside of the laboratory, that can work in real time or creates the same sort of benefit that is produced naturally with clear speech. In fact, once they identified clear speech, the MIT group became very focused on the idea of trying to come up with a computer system that would take conversational speech and create clear speech. They have not been able to achieve that as of yet, due to many of the issues I just covered. You need to be able to identify speech in challenging environments. You need to have a routine that deals with many of the different acoustic dimensions at the same time to preserve naturalness. One of the things to remember is that time marches on. These systems, no matter how good, have to work in real time to have any real effect. We currently do not have the algorithms and the computing power to take it to that level.
There have been phoneme enhancement approaches in the past where certain types of phonemes were tried to be made more intelligible. Interestingly, one type of phonemes that they have targeted is vowels. Vowels are relatively easy to identify quickly with an automatic speech recognition approach because the formants are easy to detect. They try to create greater peaks or sharpen the formants so that they stand out from each other, and in that way, the vowel is enhanced. The problem with this approach is that hearing-impaired individuals do not typically have problems with vowels, especially vowels in quiet. Any enhancement techniques that are focused on vowels do not bring us very far, because they are not attacking the root of the problem.
Another preliminary approach has been to find soft, high-frequency consonants. The idea would be that you would take a phrase like, “Please jot down how much change I need,” and identify the soft, high-frequency sounds (Figure 19). In this case, those sounds would be the /z/ in “please”, the first affricate in “much”, and the second affricate in “change.” The problem with this enhancement approach is that if you put it through fast-acting compression, it is going to make everything soft stand out (Figure 20), resulting in some of the unnatural sound quality we discussed earlier.
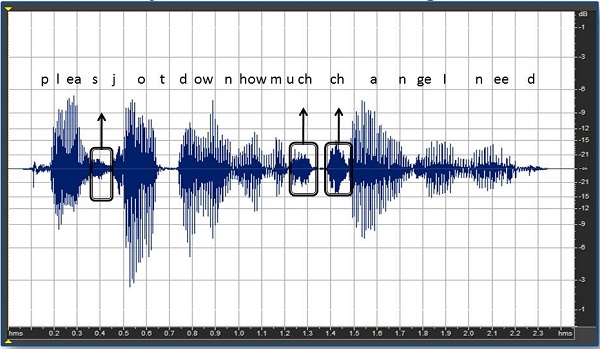
Figure 19. Identification of the soft consonants in the phrase, “Please jot down how much change I need.”
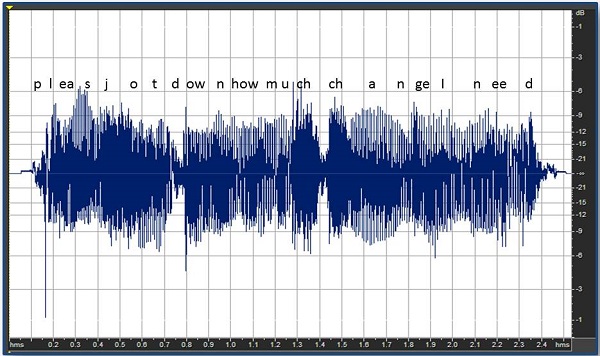
Figure 20. Effect of fast-acting compression on the soft consonants of the phrase, “Please jot down how much change I need.”
If you could do this in a speech enhancement way, you would go in and find those particular phonemes and enhance them in isolation. You maintain the natural quality of sound fairly well, while improving the perceptibility of those consonants. I went through and enhanced the passage via hand editing, similar to some of the studies that were done a decade or two ago, but in order to do that in real time, you need a speech recognition program to find those consonants and make sure that they are different than the ambient noise. As I said earlier, there are not any solid algorithms available to solve that problem right now.
Looking Forward
Theoretically, a speech enhancement strategy should be possible. We know enough about the speech signal. We know enough about human perception. What we are missing are the algorithms. The algorithm development is far behind our knowledge base. Will we have effective speech enhancement routines that can work in real time, and work in poor signal-to-noise ratios, and work on real conversational speech to make it sound clearer in the future? Maybe, but the future does not look immediately bright in this area. If a patient asks about something like this, it is not the sort of thing that you are going to advise them is right around the corner.
The good thing is that we have clear speech. We know how it works. We know that you can train a person in clear speech. In the meantime, while we are waiting for the algorithm development to catch up with us, I would strongly encourage you to consider clear speech training as something you do with the loved ones of hearing-impaired individuals. It is a natural way to make speech more distinct. It can be done very quickly and easily. It is something that we know works. I would love to have a computer system built into hearing aids that could do as well as the human ear and brain, but we are just not there yet; we may be years away. Clear speech is at least something from a clinical standpoint that we can use immediately.
Question and Answer
Is there a way to use a Dragon Naturally Speaking program with hearing aids? The idea would be that the hearing aid would do the automatic recognition and then rebuild the speech signal using an artificial voice technique.
Yes. That is the goal, to have automatic speech recognition in a hearing aid that can work in real time and work at poor signal-to-noise ratios, so that when the hearing impaired individual is in a bad situation, the hearing aid would take over, do the listening, and rebuild the speech signal at a better signal-to-noise ratio. The end goal would be to have an automatic speech recognition system like Dragon built in the hearing aids to do the listening for the person. We are just a long way from being there.
References
Payton, K. L., Uchanski, R. M., & Braida, L. D. (1994) Intelligibility of conversational and clear speech in noise and reverberation for listeners with normal and impaired hearing. Journal of the. Acoustical Society of America, 95(3), 1581-1592.
Picheny, M. A., Durlach, N. I., & Braida, L. D. (1985). Speaking clearly for the hard of hearing I (why is this here?): intelligibility differences between clear and conversational speech. Journal of Speech and Hearing Research, 28, 96-103.
Pieraccini, R. (2012). The voice in the machine – building computers that understand speech. Cambridge, MA: The MIT Press.
Schum, D. (1996). The intelligibility of clear conversational speech of young and elderly talkers. Journal of the American Academy of Audiology, 7, 212-218.
Cite this content as:
Schum, D. (2014, February). Making speech more distinct. AudiologyOnline, Article 12469. Retrieved from: https://www.audiologyonline.com


