Learning Outcomes
As a result of this course, participants will be able to:
- Explain the acoustic differences between speech and music as they relate to hearing aid fittings.
- Describe the diversity of hearing aid music sound quality and hearing aid music programs across the industry.
- Discuss hearing aid selection choices and fine-tuning adjustments that may improve hearing aid sound quality for music.
Introduction
Listening to music is an important and enjoyable part of many people’s lives. Music listening can improve quality of life through its recreational and rehabilitative function. For example, music involvement can enhance IQ in developing children (Hille, Gust, Bitz, & Kammer, 2011), and can mitigate symptoms of Alzheimer’s disease in older adults (Simmons-Stern, Budson, & Ally, 2010). Unfortunately, facilitating music listening in hearing aid wearers is not fully understood, and making music enjoyable through hearing aids can be challenging for some fittings. In this article, we will share the results of a sound quality experiment that tested whether music programs in a wide range of leading hearing aid models provide good music quality, including for the listeners’ own favorite music passages.
The Acoustics of Music and Speech
We fit hearing aids to improve audibility of sounds, such as speech and music. However, hearing aids are often programmed for listening to speech – and we should remind ourselves that speech and music can be quite different. Speech is produced by the human vocal tract and has well-defined acoustic properties that are fairly consistent across languages (Byrne et al., 1994) and that have predictable variations across genders, ages, and vocal effort levels (Byrne et al.,1994; Olsen, 1998). Average speech levels typically vary between 55 and 66 dBA (Olsen, 1998) with a dynamic range of 20 – 30 dB (Holube, Fredelake, Vlaming, & Kollmeier, 2010). Speech tends to have more low-frequency energy and a fundamental frequency as low as 100 Hz and 160 Hz for males and females, respectively (Cornelisse, Gagne, & Seewald, 1991).
Music, in contrast, can originate from a variety of sources, such as voices and instruments. Music has the potential of having a much larger dynamic range, broader frequency spectrum, and higher overall level (Chasin & Hockley, 2014). We can illustrate these differences between speech and music using displays of the energy, across frequencies, in each type of signal across frequency. The speech range is sometimes called a “speech banana”, as shown in Figure 1. This is compared to the range of energy in music, with both speech and music overlaid on the dynamic range of the human auditory system. The acoustic differences between speech and music are large, and may pose challenges for designing hearing aid programs that work as well for music as they do for speech.
These characteristics can also depend on the exact instruments and genre, and whether music is listened to live or via a recording. For example, Kirchberger & Russo (2016) found that the dynamic range of recorded classical music was between 20-32 dB while the dynamic range of recorded jazz was 13-23 dB, and that there was more relative low frequency energy in a choir genre versus a pop recording. In fact, previous studies have shown that hearing aid sound quality ratings can be affected by music genre (Arehart, Kates, & Anderson, 2011; Davies-Venn, Souza, & Fabry, 2007). Does this mean that fitting hearing aids for music listening is not a generic problem, but rather one that may need to be tailored to the individual music preferences of the hearing aid wearer?
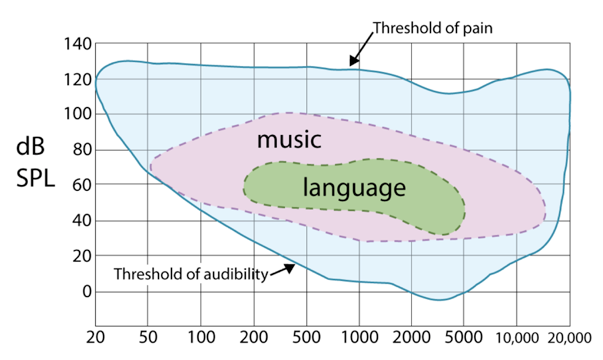
Figure 1. Frequency-intensity range of speech and music within the audibility of the human auditory system. Adapted from Limb (2011).
Hearing Aids and Music Programs
Many hearing aid manufacturers have incorporated music programs, designed to improve the sound quality of music, into their products. While the parameters of each music program differ between manufacturers, common features of a music program include slower compression, less noise reduction, reduced directionality, and reduced feedback cancellation, compared to programs intended for use with speech (Moore, 2016). At least one study has shown that different models provide different output levels for music, but also showed that individual preferred listening levels vary considerably across listeners (Croghan, Swanberg, Anderson, & Arehart, 2016; Galster, Rodemerk, & Fitz, 2014).
Previous studies report that many hearing aid users report difficulty listening to amplified music (Leek, Molis, Kubli, & Tufts, 2008). A recent survey found that only 40% of its respondents reported having a music program in their aids (Madsen & Moore, 2014). Those who did report having a music program reported music listening experiences that were essentially similar to those of users who did not have a music program. This raises the question of whether music programs were effective at improving music listening experiences for these hearing aid users.
Overall, the idea of creating a music program that makes music more enjoyable for hearing aid users is important, but is also complex. The vast differences in music types and genres, hearing aid signal processing, and listener individuality create a highly variable set of possible combinations. For these reasons, it is important to determine whether modern hearing aid music programs produce good sound quality across a wide range of genres and listeners.
Comparison of Music Sound Quality Study
Study Purpose
The purpose of this study was to examine the sound quality of hearing aid processed music across a wide range of hearing aid models and music genres. Specifically, we compared hearing impaired listeners’ subjective sound quality ratings of music processed by several premier hearing aids’ respective universal and music programs.
Methods
Participants. Participants were recruited from the National Centre for Audiology’s Translational Research Unit participant database at Western University. A total of 26 adults between ages 20 and 84 (mean = 71 yr, standard deviation = 12, 15 males, 11 females) participated in this study. All participants were regular users of hearing aids, and had bilateral symmetrical sensorineural hearing loss. Hearing losses ranged from 35-40 dB in the low frequencies to 65-70 dB in the high frequencies. Figure 2 displays the average and individual thresholds for all participants included in this study. This study was approved by the Western University Health Sciences Research Ethics Board. All participants completed informed consent and were compensated for their time.
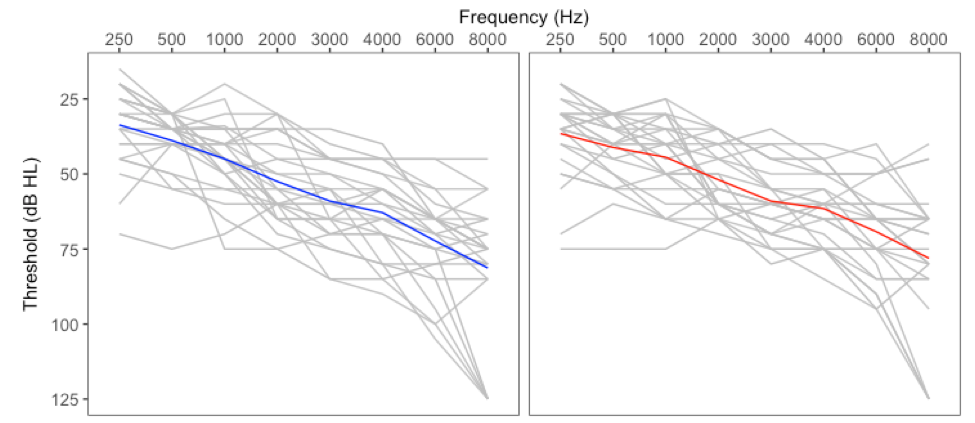
Figure 2. Pure-tone air condition audiometric thresholds for all participants (n = 26). The left panel represents thresholds for participants’ left ears and the right panel represents thresholds for participants’ right ears. They grey lines represent individual audiograms and the colored lines represent the mean audiogram across participants for each ear.
Test conditions. Hearing aids used in this study included Signia Pure 7 Binax, 7 Primax, and three other recently-available premier hearing aids from leading manufacturers. The hearing aids were individually programmed to each participant’s thresholds based on each manufacturer’s proprietary fitting formula at default settings for all parameters. Participants listened to music clips (described in the next section) processed through two program settings within each hearing aid. The first program was the manufacturer’s “first fit” (universal program) and the second program was the manufacturer’s proprietary music program. Note that the fifth hearing aid did not offer a music program so recordings were generated using only its universal program. However, these recordings were duplicated to provide a balanced set of stimuli against the other four hearing aids. A summary of the hearing aids and programs can be found in Table 1.

Table 1. Summary of hearing aids and program settings used in this study.
Music genres and recordings. Pre-recorded music samples were selected from four different music genres: classical, jazz, folk and pop. Samples were 15 to 30 seconds in length, comprising at least a full musical phrase. The classical sample included a full orchestra passage playing at a moderate-to-fast tempo. The pop sample consisted of a female vocalist, drums, electric guitar, piano and bass guitar playing at a moderate tempo. The folk sample included acoustic guitar, drums, melodic percussion instruments, and bass guitar playing at a fast tempo. The jazz sample included electric guitar, upright bass, and snare drum with brush drumsticks playing at a slow pace. A fifth genre, individualized for each participant, was also included. For this genre, participants chose a favourite song, from which a 15-30 second sample was included.
In order to play the hearing aid processed samples without the listeners knowing which aid was which, we made recordings of each hearing aid and played them back using earphones. Each of the five samples was recorded through the individually-fitted hearing aids and hearing aid programs. This yielded a total of 10 recordings per participant. Hearing aids were fitted using double dome couplings and were recorded on a mannequin (Bruel & Kjaer Head & Torso 4128 C) placed in the center of a double-walled sound-attenuated booth. Music samples were delivered to the mannequin from an Anthony Gallo A’Diva loudspeaker at 0 degrees from 76 cm away. The presentation levels were 60, 72, 73 and 78 dB SPL for the jazz, classical, pop and folk samples, stimuli, respectively, and 73 dB SPL for the favourite sample.
The hearing aid recordings were compared to high and poor quality samples when the listeners made their ratings (described below). The high quality samples, or “references” were the original samples digitally filtered to match DSL v5.0 adult targets. The poor quality samples, or “anchors” were highly distorted versions of the reference stimuli. Distortions were created by digitally center-clipping the music stimuli at 10% of the peak level. Altogether, there were a total of 70 stimuli per participant.
Ratings. A sound quality rating for each sample was obtained using the “multiple stimulus test with hidden reference and anchors” (MUSHRA) task (ITU-R, 2015). Ratings were made on a continuous scale ranging from “Bad=0” to “Excellent=100”, as shown in Figure 2. Listeners were seated in a double-walled sound booth, in front of a laptop, wearing insert earphones with a broadband frequency response (Etymotic ER-2). Participants completed a practice run with three stimuli, and adjusted the volume to their most comfortable listening level before ratings began. The ratings were done in groups of seven stimuli at a time (the same sample processed by the five hearing aids plus the corresponding reference and anchor stimuli), and there were 10 of these groups, corresponding to the 10 combinations of genres and program types (universal or music). Presentation order of the 10 groups was randomized between participants. Rating all 10 groups took 30 to 60 minutes to complete.
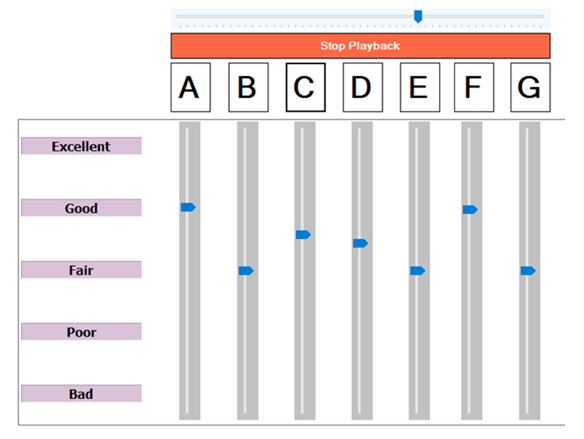
Figure 3. Screenshot of software used to gather the sound quality ratings of hearing aid processed music samples. Clicking on each lettered button played the processed sample randomly assigned to it. Participants adjusted the slider to indicate their quality ratings.
Results
Analysis. The sound quality ratings were analyzed using a three-way repeated measures analysis of variance, using Greenhouse-Geisser corrections, with genre [5], hearing aid [5], and program [2] as within-subjects factors. Post-hoc analyses were completed using Bonferroni corrections when appropriate to locate significantly different contrasts. Sound quality rating data for universal and music programs are presented in Figures 4 and 5, respectively, and compared in Figure 6.
Effect of model and genre. Hearing aid model was a significant factor in sound quality ratings (F(3.2,79.5) = 19.7, p < 0.001) collapsed across all programs and genres. The Primax was rated significantly higher than all other hearing aids (p < 0.001), except for the Binax. Hearing aid 2 was rated significantly poorer than all other hearing aids. Given that a major question of this study was the effect of music program on sound quality, further analysis was done to compare effects between hearing aids within the universal and music programs separately.
For either the universal programs (Figure 4) or the music programs (Figure 5), some hearing aids had better sound quality for music than others. Comparing specific pairs of hearing aids, we see that the Primax aid outperformed the other models, but not Binax, among the universal programs. Among the music programs, hearing aid 1 improved relative to its own universal program, and both Primax and Binax were better than models 2 and 3. The better-performing models across universal and music programs had average sound quality ratings of about 75%, which roughly corresponds to a rating of “good”.
Breaking this down by musical genre, we see that an interaction was also present between model, program type, and genre (F(8.3,207.1) = 2.0, p < 0.05). This suggests that sound quality ratings differed significantly between hearing aids, and that these differences depended on whether the hearing aids were in a music program for at least some hearing aid models and music genres. The genre-specific ratings are shown in the right panels of Figure 4, for the universal programs, and Figure 5, for the music programs. The Primax was rated as having better sound quality than other hearing aids seven times in the universal program and eight times in the music program, which was more than other hearing aids. We also saw that there were more significantly different paired comparisons within the Jazz and Pop genres, suggesting that these genres were more sensitive to the differences between models.
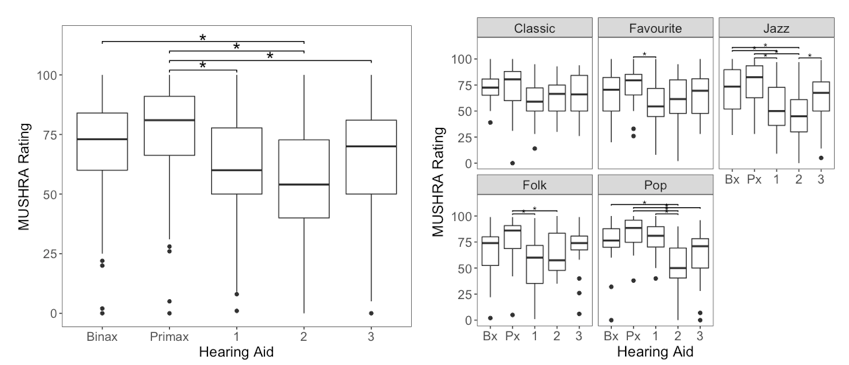
Figure 4. Boxplots showing the sound quality ratings for all hearing aids in the universal program across genres (on the left) and separated by genre (on the right). Asterisks indicate statistically significant differences between hearing aid models.
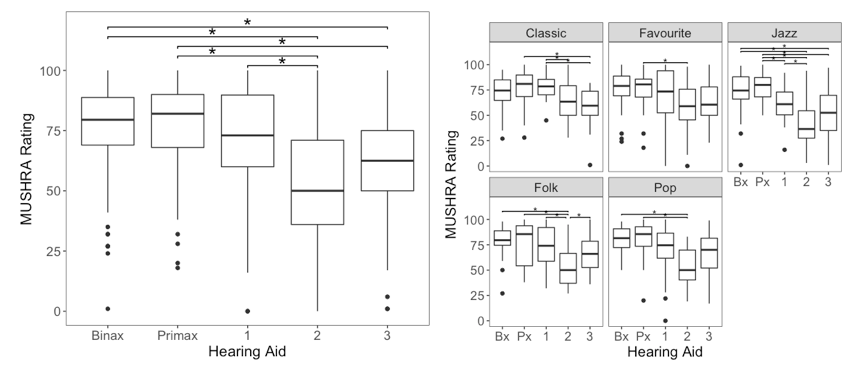
Figure 5. Boxplots showing the sound quality ratings for all hearing aids in the music program across genres (on the left) and separated by genre (on the right). Asterisks indicate statistically significant differences between hearing aid models.
Effect of music programs. Across genres, we saw a significant interaction of program by hearing aid (F(4,100) = 8.3, p < 0.001). This suggests that music programs improved sound quality relative to the universal programs for some models more than others (Figure 6; left panels of Figures 4 and 5 combined). Hearing aid sound quality improved significantly for the music programs offered by the Signia Binax and hearing aid 1. For all other hearing aids, the universal and music programs did not result in different sound quality ratings (including hearing aid 3, for which the universal and music program recordings were duplicates).
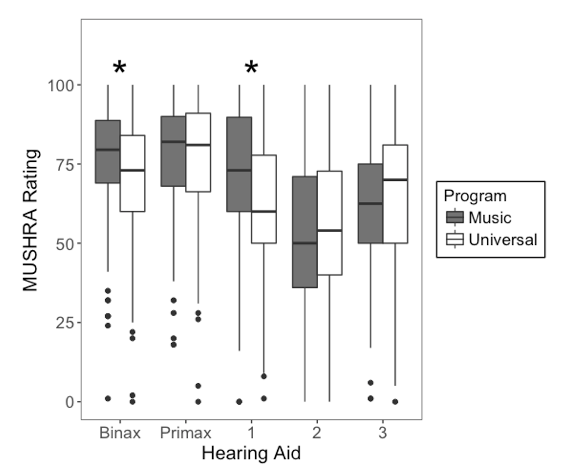
Figure 6. Boxplots showing the MUSHRA sound quality ratings for both programs for each hearing aid, across all genres. The dark grey boxplots represent the music program and the white boxplots represent the universal programs. Asterisks indicate statistically significant differences between programs within each hearing aid.
Discussion
In this study, hearing aid users rated the sound quality of music samples processed by several manufacturers’ premier hearing aids, in both universal and music programs. All hearing aids were set to the manufacturer’s default settings. Overall, this study revealed significant between-model differences in sound quality for music. The Signia Primax was rated as having the overall best sound quality across programs and genres. In the universal program, the Signia Primax was rated significantly higher than hearing aids 1, 2 and 3. In the music program, it was rated significantly higher than hearing aids 2 and 3.
Does music program matter? Overall, the majority of music programs tested did not significantly improve music sound quality. These results are consistent with recent survey findings of Madsen & Moore (2014), in which perceptions of music did not differ between using versus not using a music program. This was possibly due to hearing aids having good sound quality in either program, leaving little room for improvement for some devices. In other devices (hearing aid 1) the music program was effective, with higher ratings in the music program than in the universal program. In other words, sound quality and music program strategies may vary across models, and some combinations of model and program may be more effective than others.
Does genre matter? Our results show that sound quality differences between hearing aids may be more apparent for some genres of music compared to other genres. This finding is consistent with previous results from simulated hearing aids tested by Arehart et al., (2011). Clinically, this may mean that the most suitable hearing aid, and whether it needs or has a music program, may depend on the type of music that the patient would like to enjoy. In this study, the Primax was rated, in all genres, as having the highest sound quality more frequently than any other hearing aid. Some genres seemed to interact more often with hearing aid model and program. For example, there were only a few noticeable differences for classical music, while the jazz sample elicited many noticeable differences. The individual patient’s preferences for music type is an important consideration.
Why did sound quality vary? The sound quality of hearing aid processed music can be affected by electroacoustic parameters, including some that we can manipulate when fitting hearing aids. For example, some studies have examined bandwidth and music sound quality. Hearings aids typically amplify frequencies between 200 and 5000 Hz. However, Franks (1982) found that listeners preferred music that had additional gain in the low-frequency range below 200 Hz. Moore, Füllgrabe, & Stone (2011) and Ricketts, Dittberner, & Johnson (2008) also found that hearing-impaired listeners preferred music with additional gain in the extended high-frequency range, although listeners with steeply sloping audiograms may prefer a narrower bandwidth. Clinically, this may mean that hearing aids with a more robust bass response may produce better music sound quality.
Other studies have examined the effects of different compression settings on music sound quality. Compression compensates for elevated thresholds by amplifying low-level signals more so than high-level signals, thereby reducing the dynamic range of the hearing aid output. However, for music sound quality, linear settings are frequently preferred to more compressive settings (Arehart et al., 2011; Croghan, Arehart, & Kates, 2014; Kirchberger & Russo, 2016). If compression is used, longer time constants are frequently preferred to shorter time constants (Arehart et al., 2011; Croghan et al., 2014; Moore et al., 2011). Clinically, this may mean that slower-acting compression systems, or systems that are more linear, may produce better hearing aid sound quality.
Given these clear messages in the literature, we examined the results of the present study to determine if low-frequency and compression characteristics seemed to relate to the sound quality ratings we measured. Specifically, we selected one participant whose results were most representative of the group results of the study. This person’s ratings can be found in Table 2 for the highest and lowest-rated hearing aids, and for the music program that differed the most from the corresponding universal program. In both of these contrasts, the listener rated the better and worse hearing aid conditions very differently, with 40 to 50% improvement for the hearing aid with the better sound quality. This is a substantial change, and is likely of clinical importance.

Table 2. List of a participant’s ratings of 2 hearing aid recordings for the folk clip.
In order to learn what was different about the hearing aids and programs listed in Table 2, we analyzed the spectral and compression characteristics of hearing aid recordings of the folk music clip. This included the aided Long Term Average Spectrum (LTAS) of each hearing aid in 1/3rd octave bands from 100 Hz to 16000 Hz recorded in a 0.4 cc coupler. We compared the LTAS to the participant’s 0.4-cc coupler-based thresholds for the same overall level (Figure 7). To measure compression, we calculated each hearing aid’s short-term compression ratio by dividing the input dynamic range by the output dynamic range across frequencies (Figure 8).
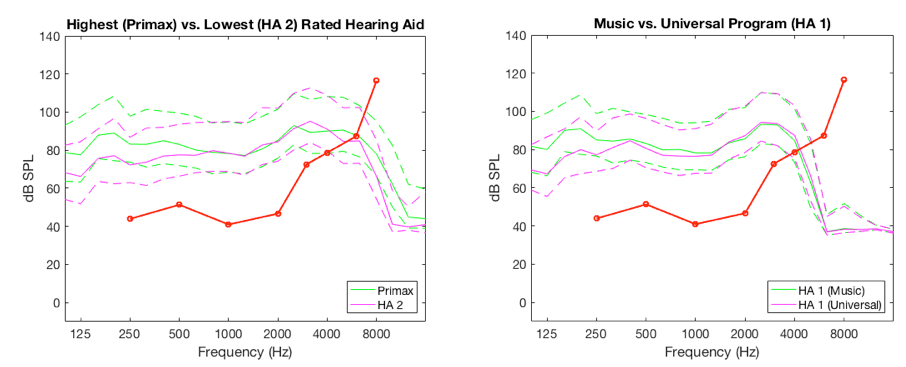
Figure 7. Frequency response curves of the highest and lowest rated hearing aids (left) and hearing aid with the biggest difference between programs (right). Solid lines represent the 0.4-cc coupler long term average spectrum of the output in response to the folk music sample, while dashed lines show the aided peaks and valleys of the signals. The distance between the dotted lines for a single color is the dynamic range of the hearing aid output. The red lines are pure tone detection thresholds, plotted in dB SPL in the 0.4-cc coupler.
The left panel in Figure 7 illustrates the hearing aid outputs for the best-rated (Primax) hearing aid versus the poorest-rated hearing aid (Hearing Aid 2). Clear differences between the shape of the aided frequency response of the two hearing aids can be noted. In the low frequencies (about 100 – 500 Hz), the Primax provided about 10 dB more output for music than did Hearing Aid 2. In the high frequencies (about 8000 – 10,000 Hz) the Primax exceeded Hearing Aid 2 by an average of 16 dB. Overall, the better-rated hearing aid had a broader bandwidth and a provided a higher listening level for the bass frequencies of this music sample.
The right panel in Figure 7 illustrates the hearing aid outputs for the hearing aid with the largest differences between its universal and music programs (Hearing Aid 1). Similar to the best-worst comparison above, there are differences in low-frequency output. The music program exceeded the universal program by an average 10 dB, particularly below about 300-400 Hz. Overall, the better-rated program had a higher listening level for the bass frequencies.
We also compared the effective short-term compression ratio for the music signal for the same two pairs of hearing aid recordings. This is not an input/output curve – recall that we only tested the music response of each hearing aid at one overall level. Instead, we tested whether each hearing aid was compressing the ongoing dynamic range of the music passage. In Figure 8, a compression ratio of 1 means that the dynamic range of the aided output was the same as the dynamic range of the unaided input. This implies that the hearing aid applied linear amplification, preserving the loud versus soft changes in level of the music signal in the short term. Comparing the best and worst hearing aids in our sample (left panel, Figure 8) we see that both hearing aids provided signal processing that preserved the short-term dynamic range of music to about 6000 Hz. Above this, Hearing Aid 2 provided a higher compression ratio than Primax, nearing a 3:1 compression ratio above 8000 Hz. However, this is likely the result of the distance between the peaks and valleys, which is smaller above these frequencies (as seen in Figure 7). It increased the measured compression values, but these higher compression ratios are not likely attributable to the compression system of the hearing aids. This affected both hearing aids, but less so for Primax. A similar characteristic is observed for the universal program versus music program comparison in Hearing Aid 1, which is slightly compressive through most of the frequencies, and has high compression ratios above the roll-off of the frequency response.
Overall, the differences in short-term compression of all four of these hearing aid conditions are less compelling than the clear differences in bass response shown in Figure 8. These compression ratios reflect device performance for a stimulus presentation level of 78 dB SPL. Live music, or music across other input level may show different compression effects.
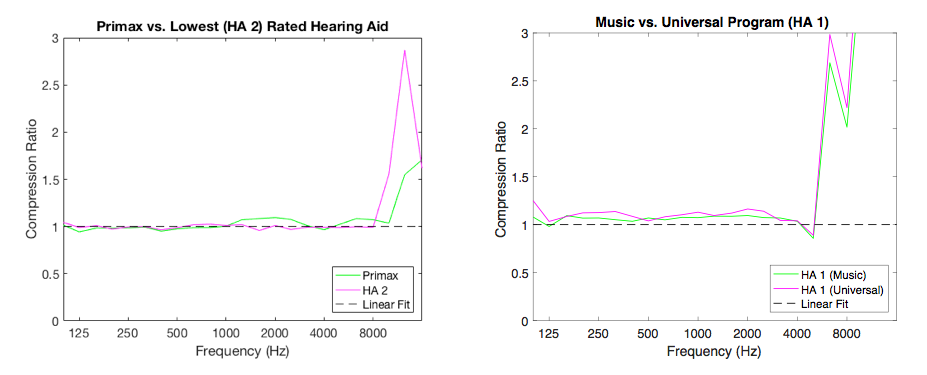
Figure 8. Short-term compression ratio as a function of frequency of the highest and lowest rated hearing aids (left) and hearing aid with the biggest difference between programs (right). Solids lines represent compression ratio of each hearing aid. The black dotted line is a reference linear fit.
Limitations
As with any study, there are limitations to what we did and how we did it. First, all hearing aid recordings in the current study were recorded using double dome couplings. These couplings significantly occlude the ear canal, resulting in minimal low-frequency leakage but also the potential for occlusion-related complaints that are not related to music. We used this highly occluded option because we wanted the listeners to evaluate the hearing aid response itself, not external signals. In real world fittings, using a fully occluding coupling method may help to retain the low-frequency response for listening to music streamed via a wireless accessory, which may be positive. However, the tradeoff between good low-frequency response for music sound quality versus other listening tasks is a consideration: vented fittings are used to support the sound quality of the wearer’s own voice, to improve spatial hearing, and to help to maintain comfort, and are therefore a frequently-chosen option. In vented fittings, the low-frequency gain is often reduced. Readers may wish to consider that this may limit the sound quality for streamed music, although we did not study this directly in this experiment.
Second, we have only evaluated the relationship between sound quality and the hearing aids’ frequency responses and compression ratios for one representative participant. This initial analysis certainly leads one to consider the importance of low-frequency response for music, and this is consistent with the literature (Franks, 1982; Moore & Tan, 2003). However, other signal processing features, such as noise reduction, feedback cancellation, frequency lowering, compression speed, distortion, coherence, noise floor, and other characteristics may have also affected sound quality. This short paper is not intended as a comprehensive evaluation of these characteristics. The interested reader is referred to studies by Arehart et al. (2011), Chasin & Hockley (2014), Madsen & Moore (2014), and Moore (2016) for further information.
Summary
Many people wear hearing aids for music listening (Leek et al., 2008; Madsen & Moore, 2014), and premium sound quality is an important factor in satisfaction and outcome for hearing aid users (Abrams & Kihm, 2015). However, hearing aid sound quality for music is not as well-understood as hearing aid sound processing for speech. The purpose of this study was to evaluate the sound quality of recorded music samples processed via five premier hearing aids set to a universal or music program. Hearing impaired listeners rated the sound quality of the samples using a multiple comparison methodology. There were significant differences in quality ratings between hearing aids, with the Signia Primax being rated higher than any other product, regardless of music genre or hearing aid program. A music program improved ratings for two of the five hearing aids tested, although the magnitude of improvement was less than the difference between a high- versus low- rated hearing aid. An analysis of one participant’s recordings suggests that a mild gain increase in the low frequencies can enhance music sound quality. Overall, this study suggests that hearing aid selection and programming can be an important factor when music sound quality is a priority of the listener.
Acknowledgements
The authors wish to thank Bilal Sheikh, Adrian Lizzi, and Scott Aker for their assistance with hearing aid recordings and stimulus preparation, as well our research participants for their time and effort.
References
Abrams, H., & Kihm, J. (2015). An introduction to MarkeTrak IX: A new baseline for the hearing aid market. Hearing Review, 22(6),16.
Arehart, K.H., Kates, J.M., & Anderson, M.C. (2011). Effects of noise, nonlinear processing, and linear filtering on perceived music quality. International Journal of Audiology, 50(3), 177–190.
Byrne, D., Dillon, H., Tran, K., Arlinger, S., Wilbraham, W., Cox, R., … & Ludvigsen, C. (1994). An international comparison of long-term average speech spectra. Journal of the Acoustical Society of America, 96(4), 2108-2120.
Chasin, M., & Hockley, N.S. (2014). Some characteristics of amplified music through hearing aids. Hearing Research, 308, 2–12.
Cornelisse, L.E., Gagne, J., & Seewald, R.C. (1991). Ear level recordings of the long-term spectrum of speech. Ear & Hearing, 12(1), 47–54.
Croghan, N.B.H., Arehart, K.H., & Kates, J.M. (2014). Music preferences with hearing aids: Effects of signal properties, compression settings, and listener characteristics. Ear & Hearing, 35(5), e170–e184.
Croghan, N.B.H., Swanberg, A., Anderson, M.C., & Arehart, K.H. (2016). Chosen listening levels for music with and without the use of hearing aids. American Journal of Audiology, 25, 161-166.
Davies-Venn, E., Souza, P., & Fabry, D. (2007). Speech and music quality ratings for linear and nonlinear hearing aid circuitry. Journal of the American Academy of Audiology, 18(8), 688–699.
Franks, J.R. (1982). Judgments of hearing aid processed music. Ear & Hearing, 3(1), 18–23.
Galster, J., Rodemerk, K., & Fitz, K. (2014, August). Preferred aided listening levels for music in the sound field. Poster presented at the 2014 International Hearing Aid Research conference, Tahoe City, CA. Retrieved from https://starkeypro.com/pdfs/research-briefs/Preferred_Aided_Listening_Levels_for_Music_in_the_Sound_Field.pdf
Hille, K., Gust, K., Bitz, U., & Kammer, T. (2011). Associations between music education, intelligence, and spelling ability in elementary school. Advances in Cognitive Psychology, 7, 1–6.
Holube, I., Fredelake, S., Vlaming, M., & Kollmeier, B. (2010). Development and analysis of an International Speech Test Signal (ISTS). International Journal of Audiology, 49(12), 891–903.
ITU-R. (2015). Recommendation ITU-R BS.1534-3: Method for subjective assessment of intermediate quality level of audio systems. Geneva: International Telecommunication Union.
Kirchberger, M., & Russo, F.A. (2016). Dynamic range across music genres and the perception of dynamic compression in hearing-impaired listeners. Trends in Hearing, 20, 1–16.
Leek, M.R., Molis, M.R., Kubli, L.R., & Tufts, J.B. (2008). Enjoyment of music by elderly hearing-impaired listeners. Journal of the American Academy of Audiology, 19(6), 519–526.
Limb, C. (2011, October). Building the musical muscle [Video file]. Retrieved from https://www.ted.com/talks/charles_limb_building_the_musical_muscle
Madsen, S.M.K., & Moore, B.C.J. (2014). Music and hearing aids. Trends in Amplification, 0(0), 1–29. doi: 10.1177/2331216514558271
Moore, B.C.J. (2016). Effects of sound-induced hearing loss and hearing aids on the perception of music. Journal of the Audio Engineering Society, 64(3), 112–123.
Moore, B.C.J., Füllgrabe, C., & Stone, M.A. (2011). Determination of preferred parameters for multichannel compression using individually fitted simulated hearing aids and paired comparisons. Ear & Hearing, 32(5), 556–568.
Moore, B.C.H., & Tan, C-T. (2003). Perceived naturalness of spectrally distorted speech and music. Journal of the Acoustical Society of America, 114(1), 408-419.
Olsen, W.O. (1998). Average speech levels and spectra in various speaking/listening conditions: A summary of the Pearson, Bennett, & Fidell (1977) report. American Journal of Audiology, 7, 1–5.
Ricketts, T. A., Dittberner, A.B., & Johnson, E.E. (2008). High-frequency amplification and sound quality in listeners with normal through moderate hearing loss. Journal of Speech, Language, and Hearing Research, 51, 160–172.
Simmons-Stern, N.R., Budson, A.E., & Ally, B.A. (2010). Music as a memory enhancer in patients with Alzheimer’s disease. Neuropsychologia, 48(10), 3164–3167.
Citation
Vaisberg, J.M., Folkeard, P., Parsa, V., Froehlich, M., Littmann, V., Macpherson, E.A., & Scollie, S. (2017, August). Comparison of music sound quality between hearing aids and music programs. AudiologyOnline, Article 20872. Retrieved from www.audiologyonline.com


