Background
There are numerous listener benefits when listening to directional sound sources, including perceived improvements in the quality and clarity of sound. The HyperSound® Audio System uses ultrasonic technology to create sound in the air. HyperSound transmits a narrow beam of sound, which focuses an incident beam of sound in a direct path to the listener, unlike conventional audio speakers. Recently, HyperSound became commercially available as a home audio device. In this study, the sound transmission characteristics of the HyperSound emitters were compared with conventional loudspeakers in an anechoic chamber. Designed to significantly diminish sound wave reflections in order to simulate a free field environment, the anechoic chamber provides an optimal environment to evaluate sound transmission characteristics. Subjects were placed in the path of the HyperSound narrow beam inside the anechoic chamber, and a sample of speech was projected from the HyperSound emitters. The same sample of speech was then projected from the conventional loudspeakers, with the subjects placed in the same positions. Comparisons were made of probe microphone measurements near the tympanic membrane of the subjects for speech samples projected by the HyperSound emitters and by the conventional loudspeakers.
Methods
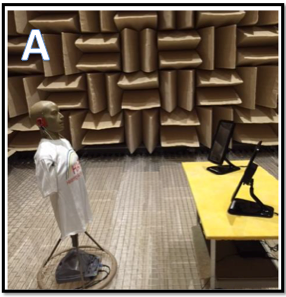
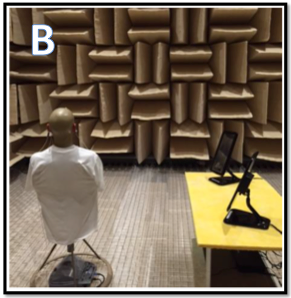
Written informed consent was obtained from subjects using a consent form approved by the IRB board at the University of Memphis. A total of 20 human adult subjects participated in the evaluation of the HyperSound Audio System. Ear-level probe microphone measurements were made in a 20’x20’x20’anechoic chamber. The Hypersound Audio System was placed in the test position, and test subjects were placed in a seated position directly in front of the Hypersound® emitters (0 degrees azimuth) at 4 feet from the emitters and at 8 feet from the emitters. Probe microphone measurements were made from the right and left ears of test subjects, and care was taken to place the probe tubing directly in ear canals in close proximity to the tympanic membrane. An otoscopic inspection was used to confirm the tubing placement in each subject. To evaluate the conventional loudspeakers, 17 human adult subjects participated and probe microphone measurements were completed with the subjects placed in the same positions corresponding to when the Hypersound Audio System was evaluated. The probe microphone system quantified peak sound pressure levels near the tympanic membrane in 1/12th octave bands from approximately 200 Hz to 8000 Hz. In addition, probe microphone measurements were made using the Knowles Electronics Mannequin for Acoustics Research (KEMAR). To determine the effects of body position on sound levels measured at the ear, KEMAR was positioned directly in front of the sound sources (at 0 degrees azimuth), with the right ear closest to the sound sources (at 90 degrees azimuth), and turned away from the sound sources (at 180 degrees azimuth) at a distance of 4 feet from the sound sources. Figure 1 illustrates the position of KEMAR at 0 degrees azimuth (Panel A, left) and 90 degrees azimuth (Panel B, right).


Figure 1. Position of KEMAR at 0 degrees azimuth (Panel A, left) and at 90 degrees azimuth (Panel B, right).
The speech stimulus presented to the subjects through the HyperSound emitters and conventional loudspeakers was the International Speech Test Signal (ISTS; Holube, Fredelake, Vleming, & Kollmeier, 2010). A calibrated Larson-Davis sound-level meter was used to measure ISTS levels in the anechoic chamber near the entrance of the ear canal of the test subjects. The outputs of the HyperSound emitters and the conventional loudspeakers were configured to produce ISTS levels at this position of approximately 70 dBA ± 3 (peak) as measured by the sound-level meter. This level was judged to be comfortable by the subjects tested in the anechoic chamber.
Position Effects on Probe Microphone Measurements
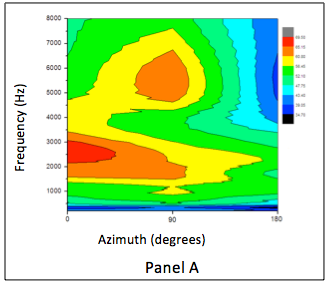
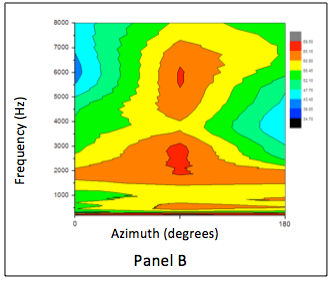
The KEMAR test subject was used to examine the effects of test subject position on probe microphone measurements. Figure 2 shows contour plots of probe microphone measurements obtained from the right artificial ear of the KEMAR test subject.


Figure 2. Probe microphone levels in KEMAR elicited by ISTS stimulus delivered via HyperSound emitters (Panel A, left) and via conventional speakers (Panel B, right).
In Figure 2, Panel A depicts probe microphone levels in KEMAR when the HyperSound emitters transmitted the ISTS stimulus, and panel B depicts probe microphone levels in KEMAR when the conventional speakers transmitted the ISTS stimulus. Contour plot axes are labeled in frequency (y-axis) and azimuth in degrees (x-axis). Red and orange sections of the contour plots represent high probe microphone levels (approximately 65-70 dB SPL), green and yellow sections represent intermediate probe microphone levels (approximately 50-60 dB SPL) and dark blue and black sections represent low probe microphone levels (approximately 30-40 dB SPL). As can be seen in panel A (HyperSound), probe microphone measurements in KEMAR were highest in the 2000-3000 Hz range when KEMAR was positioned at 0 degrees azimuth. At 90 degrees azimuth, probe microphone measurements in KEMAR were highest between 5000-6000 Hz. At 180 degrees azimuth, probe microphone levels sharply decreased in the higher frequencies (3000-6000 Hz) when KEMAR was turned away from the speakers. As shown in panel B (conventional speakers), probe microphone measurements in KEMAR at the 0 degree azimuth position are generally lower than in panel A, especially in the 2000-3000 Hz range. At the 90 degree azimuth position, probe microphone measurements in KEMAR are highest between 2000-3000 Hz and near 6000 Hz. Finally, at the 180 degree azimuth position, probe microphone measurements in KEMAR are attenuated compared to the other positions, but considerably less attenuation is seen than in panel A.
Distance Effects on Probe Microphone Measurements
Figure 3 depicts the effects of distance on probe microphone measurements in the human adult subjects.


Figure 3. Probe microphone measurements from the right ear made in 1/12th octave bands at the 0 degree azimuth position at 4 feet from the sound sources (Panel A, top) and at 8 feet from the sound sources (Panel B, bottom).
Each curve in Figure 3 represents mean probe microphone levels (in dB SPL), and the error bars represent one standard deviation from the mean. Panel A illustrates probe microphone measurements (from the right ear) made in 1/12th octave bands at 4 feet from the sound sources at the 0 degree azimuth position. Panel B illustrates probe microphone measurements (from the right ear) made in 1/12th octave bands at 8 feet from the sound sources at the same azimuth. Trends in the data show that the ISTS output from the HyperSound emitters (blue curves) generate higher probe microphone levels in the ear of human adult subjects in the mid-frequency range compared to the output generated by the conventional speakers (orange curves) when measurements occur at 4 feet from the sound sources. Conversely, the output from conventional speakers generates higher probe microphone levels in the ears of human adult subjects in the lower frequencies compared with the output produced by the HyperSound emitters. At 8 feet from the sound sources, there is more overlap between the HyperSound and conventional speaker curves, with slight reductions in level compared with measurements made at 4 feet.
Discussion
The results of this study illustrate the directional characteristics of the HyperSound emitters. The contour plots depict differences in probe microphone speech levels measured in KEMAR for the HyperSound emitters and conventional loudspeakers. The narrow beam of sound from the HyperSound emitters produced higher probe microphone levels in the 2000-3000 Hz range compared with the conventional speakers when the KEMAR test subject was in the 0 degree azimuth position. Presumably, this reflects a higher concentration of sound that is modified by the resonance effects of KEMAR. In the 180 degree azimuth position, the pronounced differences between the HyperSound and conventional loudspeaker contour plots in the 3000-6000 Hz range suggest that the narrow beam from the HyperSound emitters was reflected more when KEMAR’s back was facing the emitters. Sound transmission from the conventional speakers was more diffuse, which resulted in probe microphone sound levels that were less attenuated.
The effects of distance on probe microphone measurements in the human adult subjects indicated that within the confines of the anechoic chamber, HyperSound emitters produced output that decreased with increasing distance. However, the magnitude of these decreases in the lower frequencies was less for the HyperSound emitters than for the conventional speakers. The findings of this study provide objective evidence of the sound transmission characteristics of the HyperSound Audio System and conventional speakers in an anechoic environment.
Acknowledgments
This study was funded by a grant provided by the Turtle Beach Corporation. Portions of this report were presented as a poster session to the 42nd Annual Scientific and Technology Conference of the American Auditory Society in March of 2016.
References
Holube, I., Fredelake, S., Vleming, M., & Kollmeier, B. (2010). Development and analysis of an international speech test signal. Int J Audiol, 49, 891-903.
Citation
Bhagat, S., Yellamsetty, A., & Taylor, B. (2016, November). A comparison of HyperSound and conventional loudspeaker transmission characteristics in an anechoic environment. AudiologyOnline, Article 18525. Retrieved from https://www.audiologyonline.com.


