Introduction
A primary goal of the hearing care professional is to improve their patients’ quality of life. In every day practice, this is done by fitting and fine-tuning hearing aids with the goal of ensuring client satisfaction. With this goal in mind it is interesting that one of the recent MarkeTrak surveys (Kochkin, 2010) shows that out of the 10 most important factors found to influence overall user satisfaction, 5 are related to sound quality of the hearing aid (clarity of sound, natural sound, richness/fidelity of sound, comfort with loud sounds, sound of own voice (occlusion)). Moreover, the MarkeTrak V study (Kochkin, 2011), which comprises a large-scale investigation of the reasons why some hearing aids end up in the drawer, indicates that the sound quality of a hearing aid can be decisive for whether a hearing aid is accepted or rejected by the wearer.
In the audiology clinic the first test of sound quality of a hearing aid is determined by daily wear and the reaction of a new user to their first experience of amplified sound or the reaction of an experienced user to a new device.The typical hearing aid user does not usually comment directly on the sound quality of their instruments, but talks about speech clarity and speech understanding, which are directly related to sound quality. In particular, if the amplified signal contains artifacts or distortion, the user will frequently report poor speech understanding particularly when ambient levels are high – such as in a busy restaurant.. This results in an overall dissatisfaction with the hearing aids, more returns for credit, more need for fine-tuning and more visits to the clinic.
A recent paper (Baekgaard, Knudsen, Arshad, & Andersen, 2013) hypothesizes that a new A/D converter design with an upper limit of 113 dB SPL available in the Widex DREAM hearing aid can address some of these issues. This new design should generate benefits for the hearing aid wearer in a number of different real life situations with loud inputs like listening to music, trying to hear speech in a busy restaurant or listening to speech on a busy street with traffic noise. This hypothesis was supported in a laboratory trial on the efficacy of the Widex DREAM hearing aid in improving speech recognition in loud noise (Baekgaard, Rose, & Andersen, 2013) and further supported by a study including 10 musicians with hearing loss (Chasin, 2014). An independent trial published by Jessen, Baekgaard, & Andersen (2014) showed that a panel of hearing impaired listeners rated the DREAM sound as well-balanced, very natural, full, and characterized by a low degree of distortion.
To further substantiate the benefits of the new A/D converter design available in the Widex DREAM hearing aid in terms of speech understanding, sound quality and user satisfaction, a clinical trial was conducted in a real world clinical situation.
Clinical Trial - Sound Quality
Method
Subjects. A multi-site clinical trial with 26 hearing aid wearers with a mild to moderate sensorineural hearing loss was conducted. Average audiometric thresholds are shown in Figure 1. All subjects were experienced hearing aid users (14 Widex users, 12 non-Widex users), with the majority being satisfied with their current devices. The age of the subjects ranged between 48 and 91 years (mean age of 67 years).
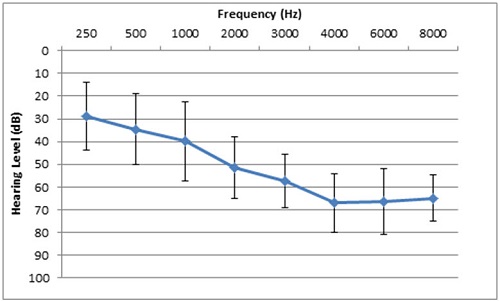
Figure 1. Average hearing aid thresholds and 1 standard deviation of the 26 subjects.
All subjects were fitted with Widex DREAM 440 hearing aids, using standard Widex fitting and fine-tuning protocols. The real world benefits provided by the new hearing aids were evaluated using a range of outcome measures.
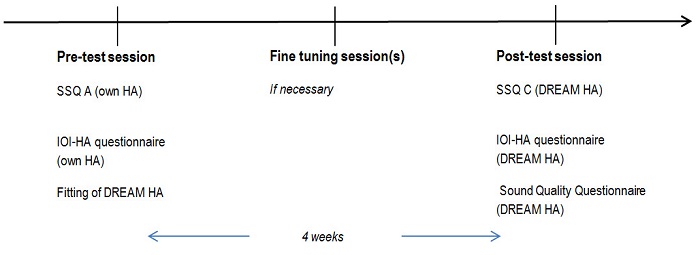
Figure 2. Timeline of the fitting and evaluation regime.
Outcome measures. The standardized Speech, Spatial and Qualities of Hearing Scale (SSQ) A and C (Gatehouse & Noble, 2004) and the International Outcome Inventory-Hearing Aids (IOI-HA) (Cox et al., 2000) were administered as the principal outcome measurement tools in order to compare own hearing aids with new hearing aids.
The SSQ self-assessment questionnaire measures listening ability or experience in a large number of different listening situations within the three overall domains: speech hearing, spatial hearing, and qualities of hearing. In this study, the domains speech hearing and qualities of hearing were used. The speech hearing (subset 1) contains 14 different listening situations addressing speech understanding. The qualities of hearing (subset 3) contains questions related to sound quality, clarity and naturalness of the signal in 18 different situations (details of the questions are included in the Appendix).
The SSQ-A was applied before the fitting of the new device to provide a baseline. It consists of a visual analogue scale ranging from 0-10. The SSQ-C was applied at the end of the study assessing the perceived difference between the old and the new device. It uses a comparative visual analog scale, where –5 corresponds to much worse, 0 = no change and 5= much better than the old device. It is thereby a relative measure of change, rather than an absolute measure of benefit.
The IOI-HA is used for large epidemiological studies, but was originally intended to also have application in comparative hearing aid studies (Cox et al., 2000). It covers a minimal set of seven core outcome items (Use, Benefit, Residual activity limitations, Satisfaction, Residual participation restriction, Impact on others and Quality of life). The items are practically oriented and comprise a mini-profile in addition to the scale. Results are measured on a 5 point rank, with the 5th rank marking the most desired outcome. The IOI-HA was applied with own hearing aids and again with the new hearing aids.
A complementary 6- item sound quality questionnaire developed specifically for this clinical study was administered at the end of the study.
Results and discussion
SSQ - A: Baseline scores. The subjects in this trial were selected on the basis that they were happy with their current amplification but willing to try something new. The SSQ-A baseline scores indicate that this satisfaction relates primarily to the easiest listening situations. The mean baseline value found for the Speech Hearing Section, addressing speech understanding, was 5.6 (Figure 3). If we take a closer look at the individual questions like one-to-one conversations (Q2) and listening in small groups (<5 people) with audiovisual clues (Q3) it is clear that the subjects, giving an average score of 8.7 and 7.1 out of 10, were generally very satisfied with their present aided abilities. If we look at the questions with the lowest scores it is clear that these are seen in the more difficult listening situations such as following the conversation in a busy restaurant (Q4, Q6), with average scores of 4.7 and 4, at reverberant places (Q7) with an average score of 4.4 and when following the conversation of two speakers simultaneously (Q14) with an average score of 4.5. This shows that in more difficult listening situations there is still room for improvement with a new device.
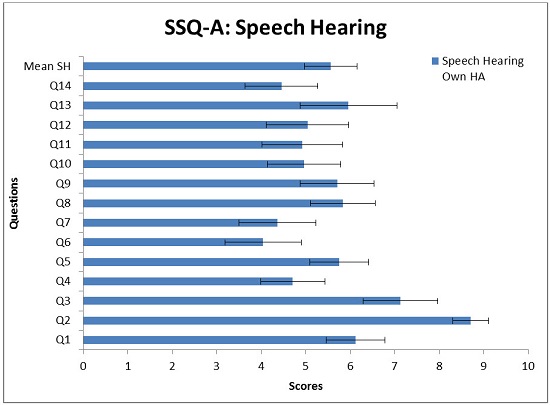
Figure 3. Mean scores and 0.95 confidence interval for the 14 questions in the SSQ-A Speech Hearing.
The Qualities of Hearing sub-section, addressing sound quality in different listening situations, had a mean score of 6.7 (Figure 4). Across all situations, the listening experience was slightly above average. The questions obtaining the lowest mean scores were question 14 and 15 with average scores of 5.7. Both of these questions are related to listening effort. Again this shows us that the subjects are generally very satisfied with their hearing aids but there is still room for improvement regarding sound quality.
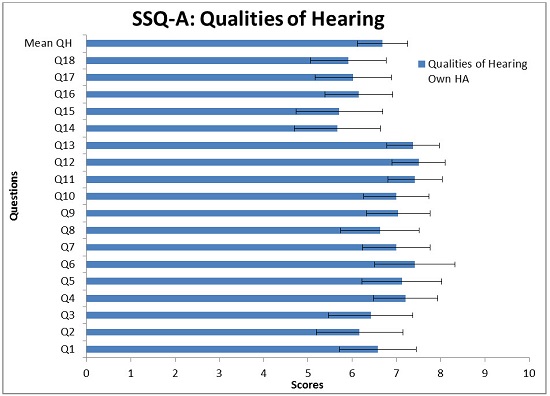
Figure 4. Mean scores and 0.95 confidence interval for the 18 questions in the SSQ-A Qualities of Hearing.
SSQ – C: Comparative scores. At the completion of the trial the SSQ – C: “Speech Hearing” and “Qualities of hearing” sections were administered as a measure of the degree of difference between the old aids and the new DREAM hearing aid.
On the Speech Hearing Section, addressing speech understanding, significant improvements are seen on all questions with a mean improvement score of 1.9 (Figure 5). Looking at the most difficult listening situations that received the lowest baseline scores like “following the conversation at a busy restaurant” (Q4 and Q6) and reverberant places (Q7) it is clear that the DREAM hearing aid is perceived as being significantly better than the old hearing aids with average scores of 2.1; 1.8 and 2.1 (p<0.001). Question 14 “following the conversation of two speakers simultaneously” receives a lower score than the other two (1.0), but a significant improvement is still seen (p<0.05). Looking at the easier listening situations that received a high baseline score like one-to-one conversations (Q2) and listening in small groups (<5 people) with audiovisual clues (Q3), it is clear that the DREAM hearing aid improves speech understanding in these situations as well. In fact, these two situations are the situations showing the most dramatic improvements with average scores of 2.5 and 2.5. This shows us that the users perceive a great improvement in speech understanding with the new DREAM440 hearing aid across a range of different listening situations, which impacts on all aspects of everyday life and not only in situations with high input levels.
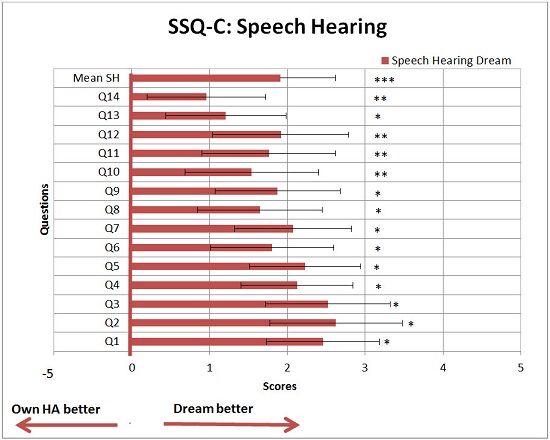
Figure 5. Mean scores and 0.95 confidence interval for the 14 questions of the SSQ-C- Speech Hearing. A score of +5 indicates that the participant is doing “much better” with Dream than with the own hearing aid; a score of -5 indicates that the participant is doing “much worse” with Dream. One asterisk denotes a significance level of p<0.001, two asterisks denote significance level of p<0.01, three asterisks denote significance level of p<0.05, meaning that the scores are significantly different from 0.
On the Qualities of hearing section, where questions addressed the clarity and naturalness of the signal, significant improvements (p<0,001) were found for all questions with a mean improvement score of 2 (see fig. 6). Looking at question 14 and 15 that got the lowest baseline scores and are related to listening effort it is clear that the DREAM hearing aid shows significant improvement in these areas as well (p<0.001). In total this shows us that the DREAM440 hearing aid is perceived as having a statistically significant better sound quality than their old hearing aids.
It is important to note that the question where the change was most significant (Q8) relates to the clarity and naturalness of music, which corroborates the findings by Chasin (2014). Questions 9 and 10 are also questions about the clarity and naturalness of everyday sounds and other people’s voices and again the degree of difference for the new DREAM hearing aids was the highest.
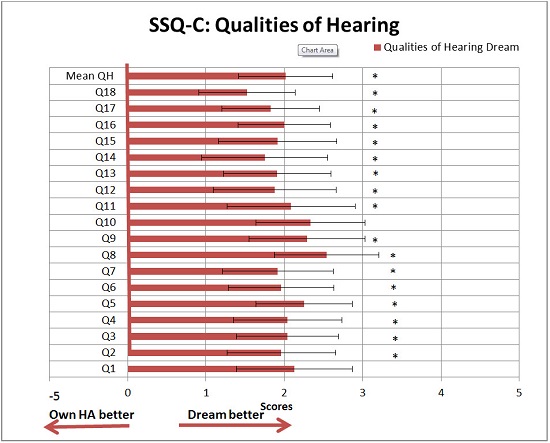
Figure 6. Mean scores and 0.95 Confidence Interval for the 18 questions of the comparative version of the SSQ-C- Qualities of Hearing. A score of +5 indicates that the participant is doing “much better” with DREAM than with their own hearing aid; a score of -5 indicates that the participant is doing “much worse” with DREAM. One asterisk denotes a significance level of p<0.001, meaning that the scores are significantly different from 0.
IOI - Hearing Aid Outcomes. The scores on the IOI-HA show statistically significant improvement (p< 0.001) in hearing aid outcomes for the DREAM440 hearing aid compared to the subjects’ original hearing aids. The overall scores for the IOI-HA questionnaire can be seen in Figure 7.
Significant differences are seen for the subscales related to improvements in difficult listening situations. According to Baekgaard, Knudsen, Arshad and Andersen (2013), the increased headroom of the A/D converter in the Widex DREAM hearing aid makes it possible that louder input levels pass through undistorted and thereby enable the signal processing to operate optimally. This will most likely have a beneficial effect on the hearing aid user’s perception in situations where speech is produced in loud background noise. Even though the IOI-HA does not point out in which specific listening situations the subject finds it difficult to hear. It seems reasonable to presume that listening in noise is one of them, as this is still one of the most difficult situations experienced in everyday life.
The results on the IOI-HA are in agreement with the results from the SSQ-C that show significant improvements in speech understanding in more difficult listening situations with the new device.
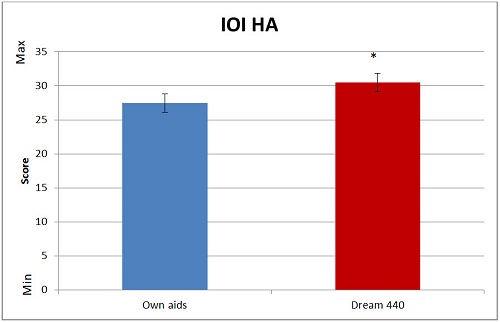
Figure 7. Overall IOI-HA scores and confidence interval for own aid and DREAM. Asterisk indicates significantly different mean scores for the hearing aids (p<0.001).
Sound Quality Questionnaire. At the end of the study the subjects were asked to complete a short 6-item questionnaire devised to address direct questions about the DREAM sound quality, in addition to the inferential questions used in the SSQ and IOI-HA. The mean scores and the confidence interval are shown in Figure 8.
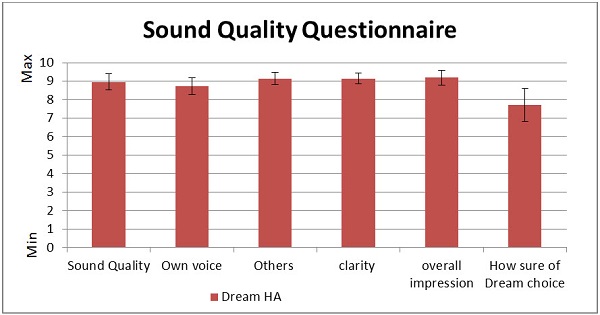
Figure 8. Mean scores for the Widex sound quality questionnaire.
All participants rated the DREAM hearing aid with a very high score on sound quality, both overall and when referenced to speech, either their own voice or the voice of others. In fact, 8 subjects gave the hearing aids a score of 10/10 for overall sound quality, with a mean score of 8.95. In addition, 10 subjects rated their overall impression of the hearing aids as 10/10, which reflects the overall quality, clarity and naturalness of the signal. If we keep in mind that these subjects were all experienced users of high performance hearing aids, these results are very encouraging and validate what we experienced in the clinic. During the study most subjects were happy with the hearing aids and did not report problems or a need for fine-tuning. Also when listening to the comments of the clients, statements like “Speech is clearer”, “the sound of these aids is more natural”, “For the first time I can hear clearly in very noisy situations” and “good for listening to music” were not uncommon.
Conclusion
Sound quality has been identified as one of the strongest predictors of hearing aid satisfaction. However, in the clinic, users do typically not comment directly on sound quality, but on speech clarity and speech understanding. In particular, if the amplified signal contains artifacts or distortion, the user will frequently report poor speech understanding particularly when ambient levels are high, like in a busy restaurant or the like. Engineers have hypothesized that a new A/D converter design able to handle input levels of up to 113 dB SPL without introducing distortion or artifacts improves the user’s speech understanding and satisfaction with the hearing aids in these challenging situations.
In this clinical trial, our goal was to investigate if the new A/D converter design was able to improve the perceived sound quality and speech understanding of users in a range of different listening situations throughout their everyday lives. This was done by applying a range of standardized hearing aid outcome measures. The users in the study were all satisfied with their present hearing aids but willing to test a new device.
All three outcome measures used in this clinical study indicated very positive outcomes for the majority of subjects. Results on the SSQ –C subsets 1 and 3 on speech hearing and qualities of hearing, show significant improvements in sound quality and speech intelligibility across a range of listening situations including key questions related to difficult situations. In addition, significant improvements are seen on the overall outcomes recorded by the IOI-HA and finally on the sound quality questionnaire developed specifically for this study. All together the results support the hypothesis that the new A/D converter design is able to increase perceived sound quality and speech understanding in a range of different listening situations, including traditional challenging situations where ambient levels are high. These improvements lead to greater user satisfaction and ultimately to an improved quality of life of our clients.
References
Cox, R.M., Hyde, M., Gatehouse, S., Noble, W, Dillon, H., Bentler, R.,...et al. (2000). Optimal outcome measures, research priorities, and international cooperation. Ear & Hearing, 21(4), 106S–115S.
Baekgaard, L., Knudsen, N.O., Arshad, T., & Andersen, H.P. (2013). Designing hearing aid technology to support benefits in demanding situations, Part 1. Hearing Review, 20(3), 42-59.
Baekgaard, L., Rose, S., & Andersen, H.P. (2013, May 31). Designing hearing aid technology to support benefits in demanding situations, Part 2. Hearing Review. Retrieved online from www.hearingreview.com
Chasin, M. (2014, January). A hearing aid solution for music. Hearing Review, 28-31.
Gatehouse, S., & Noble, W. (2004). The Speech, Spatial and Qualities of Hearing Scale (SSQ). International Journal of Audiology, 43, 85-9.
Jessen, A.H., Baekgaard, L., & Andersen, H. P. (2014, January). What is good hearing aid sound quality, and does it really matter?AudiologyOnline, Article 12340. Retrieved from: https://www.audiologyonline.com
Kochkin, S. (2000). MarkeTrak V: “Why my hearing aids are in the drawer”: The consumers’ perspective. Hearing Journal, 53(2), 34-41.
Kochkin, S. (2010). MarkeTrak VIII: Consumer satisfaction with hearing aids is slowly increasing. Hearing Journal, 63(1), 19-32.
Cite this content as:
Rawls, S., Weiner, J., Nunes, R., & MacDonald, O. (2014, October). A clinical evaluation of sound quality in hearing aids. AudiologyOnline, Article 13019. Retrieved from: https://www.audiologyonline.com


