Learning Outcomes
After this course learners will be able to:
- Describe the overall concept of the Signia Assistant.
- Describe the benefits of an artificial intelligence-enabled personal assistant for hearing aid wearers and hearing care professionals.
- Explain some of the reasons an artificial intelligence (AI) assistant with a deep neural network (DNN) can improve its performance over time.
Introduction
Despite major advances in all steps of the hearing aid fitting process, fine-tuning to arrive at the correct settings is still, and likely will remain, a key part of the wearer’s initial experience. As hearing care professionals (HCPs) know, a one-size-fits-all approach, in which initial hearing aid settings are based solely on an audiogram and remain unchanged, is largely ineffective. Oftentimes, wearers with the same audiograms start out with similar hearing aid settings, but after several trial-and-error adjustments, end up with vastly different preferred settings. These differences in settings underscore the individualized nature of fitting hearing aids — satisfaction and acceptance are driven by the wearer’s ability to fine-tune their hearing aids, especially during initial use.
Today, when conducted by a skilled HCP, the fine-tuning process can produce remarkable results that lead to excellent wearer benefit and satisfaction. However, even the best HCP cannot always tackle some of the obvious limitations of the manual fine-tuning process. These limitations can include the need for the wearer to be present in the clinic for the fine-tuning appointment and the wearer’s ability to remember and accurately describe the problems that need to be addressed. Additionally, as demonstrated by Anderson et al. (2018), how the HCP interprets the wearer’s comments, especially when an almost infinite number of adjustments can be found in the fitting software of modern hearing aids, is a highly variable process.
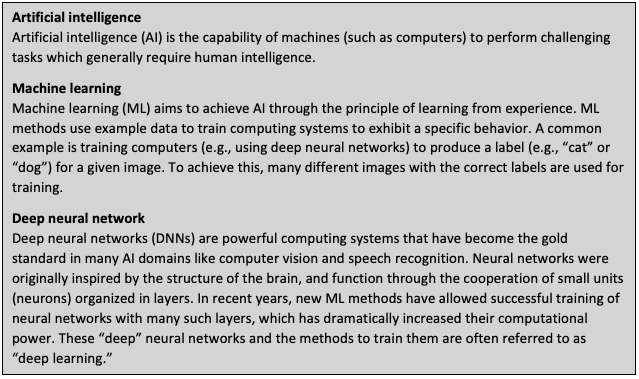
In 2020, Signia introduced Signia Assistant (SA) as a new approach to fine-tuning using artificial intelligence. SA offers several new potential benefits to wearers and HCPs that address the limitations of traditional fine-tuning (Høydal & Aubreville, 2020; Taylor & Høydal, 2023). The core idea behind SA is to use a deep neural network (DNN) to suggest hearing aid adjustments while the wearer is experiencing difficulties. By using an AI-driven approach, it is possible to predict the best possible solution to a problem the wearer may experience in any situation, at any time. The prediction made by SA is based on three types of information: 1.) the wearer’s listening situations and reported problems in those listening situations, 2.) data from other anonymized fittings and the different audiological solutions that may have solved those problems, and 3.) the individual wearer’s preferences.
In previous studies, the performance and benefits of SA have been investigated by surveying hearing aid wearers and HCPs about their experiences (Høydal et al., 2020; Høydal et al., 2021). Results have been overwhelmingly positive, showing high levels of satisfaction among wearers and HCPs alike. In this article, we evaluate a large sample of the more than 150,000 Signia hearing aid wearers around the world who have used SA in their daily lives. The data clearly demonstrate SA’s ability to provide widely accepted solutions and how its machine learning system leads to improved performance over time. Before analyzing the data, we explain the functionality of SA and how AI is used to generate individualized solutions for wearers.
Signia Assistant — How it works
The basic concept of SA is as simple as its user interface (see Figure 1). When the wearer experiences a problem, they can activate SA via the Signia App installed on their smartphone. First, the wearer indicates whether the problem relates to their own voice, other voices, sound quality, handling of the hearing aids, or to sound streaming. In case of a handling problem, the wearer is asked to specify the problem and SA will then display a video for their specific hearing aids. If a perceptional problem – with either external sound or streamed sound – is indicated, the wearer can further explain the problem by answering a few simple questions as shown in the two middle screens in Figure 1, where a streaming problem is addressed. SA will immediately suggest a solution to the problem (i.e., a modified hearing aid parameter setting) and it will be programmed into the hearing aids. The wearer can keep or reject the change or request an additional change to further improve the listening experience. The changes kept by the wearer are automatically made part of the Universal program in the hearing aids, thus ensuring the fitting is incrementally more tailored to the individual wearer as they use SA.
Importantly, all changes made by SA are available for the HCP to inspect via the Connexx fitting software the next time the wearer enters the clinic. This makes the system transparent for HCPs, who can use the added data on the wearer’s preferences as a foundation for further counseling during a follow-up session. Consequently, SA empowers hearing aid wearers as well as HCPs.
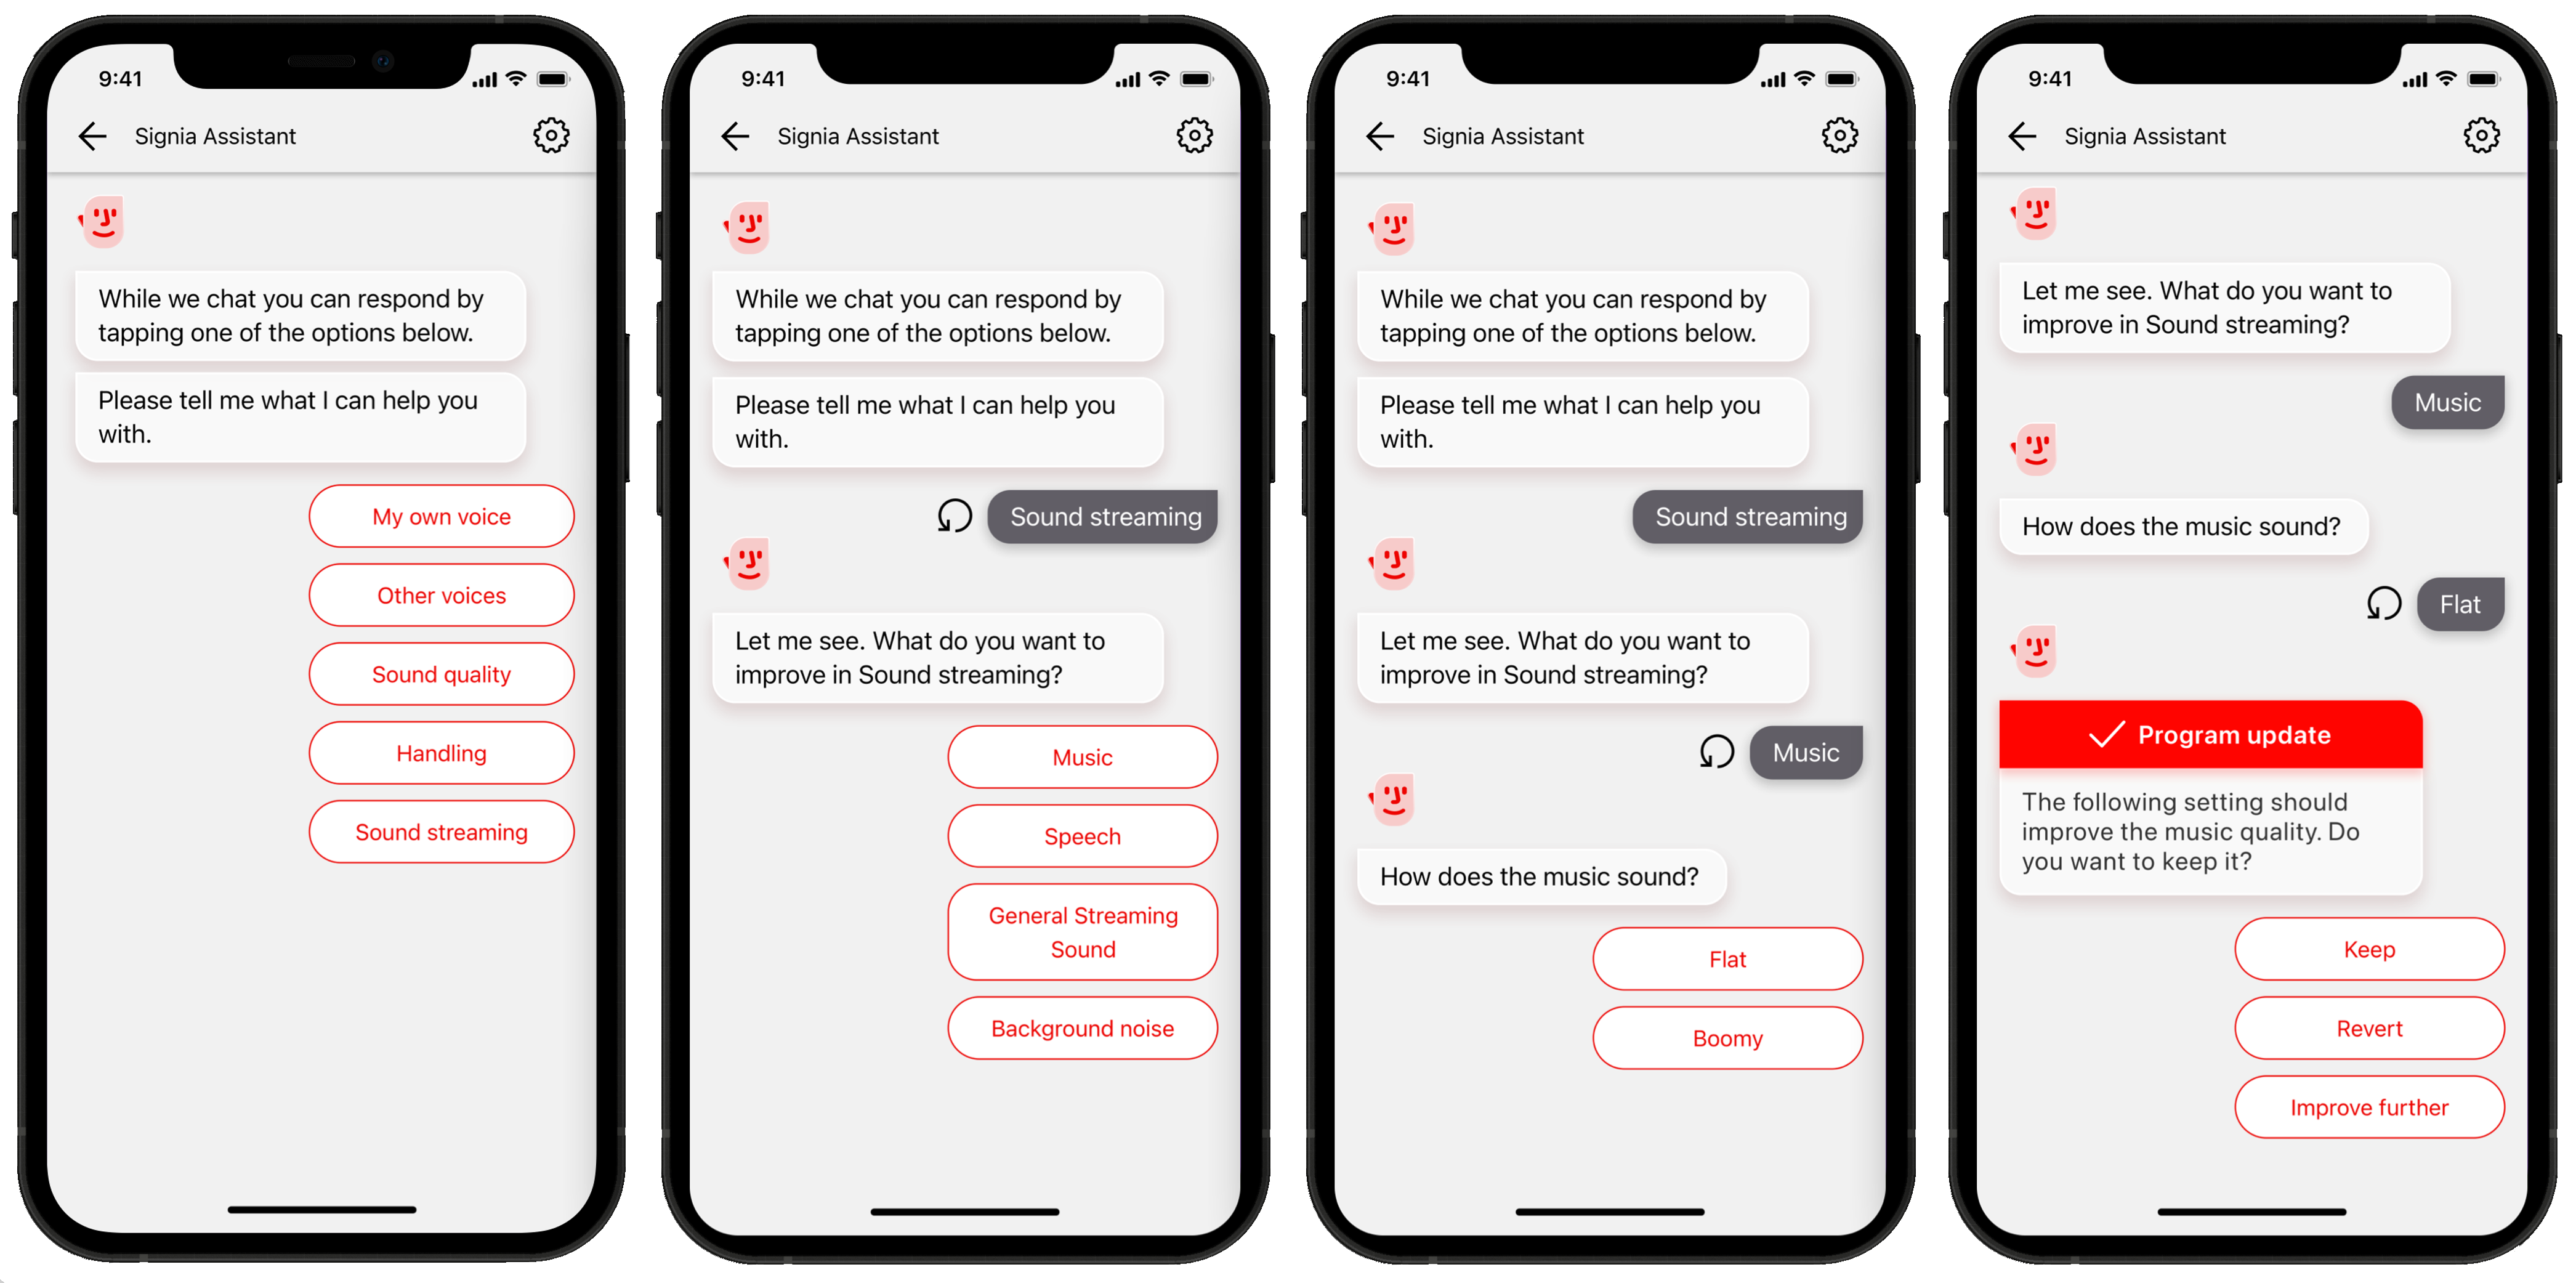
Figure 1. The user interface of Signia Assistant. The wearer specifies a problem (left and two middle screens) and a solution is presented, which the wearer can keep, revert, or further improve (right screen).
Under the hood, advanced machine-learning is the key element in SA. Figure 2 shows, in a simplified form, how this system works. When a wearer activates SA via the app, the hearing aids analyze the current acoustic environment (e.g., sound level and soundscape classification). This information is combined with audiometric information about the wearer (stored in the hearing aids) and the problem description indicated by the wearer. This pool of information is sent via the wearer’s smartphone to a cloud-based AI system, which combines a DNN with a Wearer Preference Learning module.
For the problem described by the wearer, the AI system proposes a solution — one tailored to the problem, the environment, and the wearer’s preferences (learned from previous interactions between the wearer and SA). This fine-tuning solution is transferred to the hearing aids to allow immediate evaluation by the wearer. The wearer then provides the feedback (keep/reject/improve further), which decides whether the Universal program is updated, and in turn, improves the system by updating the Wearer Preference Learning module. All data handled by the cloud-based AI system are fully anonymized. This pool of anonymized data, gathered from thousands of wearers around the world, is used to improve the system further by retraining the DNN. For more information on the SA functionality, please see Høydal & Aubreville (2020) and Wolf (2020).
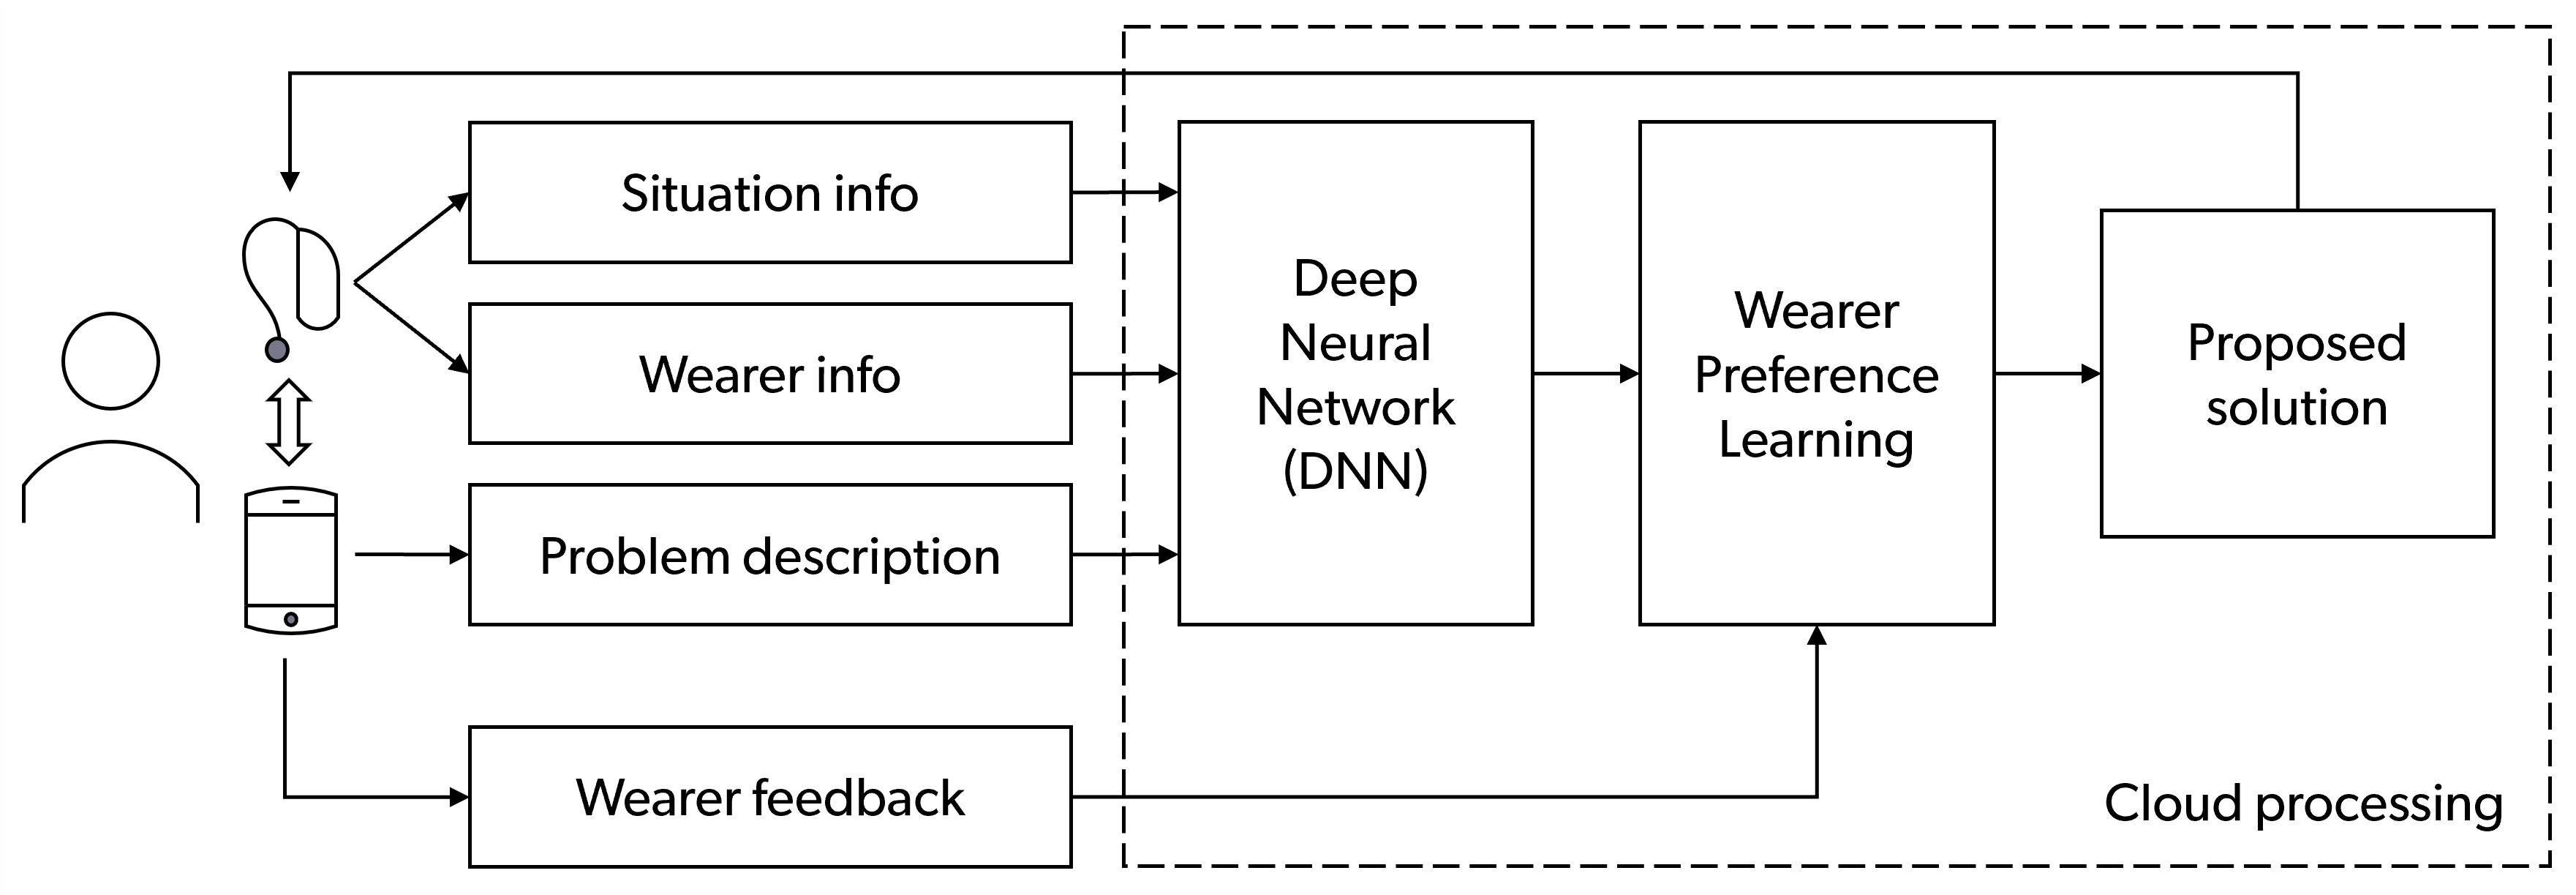
Figure 2. Simplified diagram showing the main elements and functionality of Signia Assistant. The DNN and Wearer Preference Learning are running in the cloud. All data sent to the cloud are fully anonymized.
Generating Individualized Solutions with AI
The heart of the SA is the cloud-based AI system, which proposes individualized solutions using a DNN. This adds two major advantages to the SA.
First, DNNs enable solutions that are individualized and fine-tuned to the specific wearer and environment. This is a key improvement compared to traditional, rules-based AI methods. One way a traditional AI system could attempt to propose a hearing aid setting update would be to use a set of rules in the form of a table, where one entry would describe the conditions under which a specific solution is selected. In our case, such a rule could be: "If speech intelligibility is bad and the environment is noisy, then increase the gain in the mid-frequency range."
Such a table cannot handle the complexities the SA is faced with (cf. Figure 2), as the vast number of possible combinations of acoustical environments and wearer info (such as individual audiograms) would require an immeasurable number of explicitly formulated rules. Machine learning methods such as DNNs do not rely on explicit rules but are trained using sample data. This sample data specifies the desired behavior in one particular case, which allows the DNN to discover the rules for generating solutions by itself. After training, the DNN can generate highly individualized solutions for all possible environments and wearers — not only those used for the training — using these implicit rules.
The second advantage of using a DNN is in combining different kinds of knowledge to make fine-tuning adjustments that can solve common fitting problems. For example, the information used to train the DNN of SA includes scientific findings documented in the literature (e.g., Jenstad et al., 2003), experience from decades of hearing aid development, and feedback from previous use of SA. These data are combined to form the set of sample data used to train the DNN. Hence, the knowledge base of SA is exceptionally broad. Since the DNN includes millions of previous interactions with SA, it is well-equipped to handle remarkably infrequent individual scenarios that no single HCP has likely encountered before.
Over time, the knowledge base of SA increases as more data are accumulated and fed into the system. The new data are used to retrain the DNN, leading to better proposed solutions. This is one of the ways in which SA can improve its performance over time. It can further improve for the individual wearer via their continued use of SA. Every time the wearer uses SA, the system learns more about that individual’s preferences, resulting in better solution proposals. These updates are particularly significant if the individual wearer has vastly different preferences from the average wearer. Finally, the performance of SA is also associated with the hearing aid technology used. When new hearing aid technology and features are introduced, it allows for new — and possibly more effective — adjustments to be made and provides new options for SA to tackle specific problems.
Analysis of Acceptance Rates
For this paper, we examined the acceptance rates observed in large samples of hearing aid wearers who have used SA in their everyday lives. We defined the acceptance rate as the share of the total number of solutions proposed by SA that were accepted by wearers and kept in the hearing aids. The acceptance rate can be calculated for each type of problem indicated by the wearer, and it can be calculated for each type of solution. Thus, the acceptance rates give a direct indication of how well SA can solve different types of problems, as well as the effectiveness of various proposed solutions. Assuming that acceptance of a solution is linked to improved hearing performance, the acceptance rates can be directly associated with wearer satisfaction.
In the analysis of the acceptance rates presented in this paper, we wanted to examine how the performance of SA has evolved over time. We have analyzed use data gathered during three distinctive periods: the first quarter of 2021 (2021-Q1), the fourth quarter of 2021 (2021-Q4), and the third quarter of 2022 (2022-Q3). Therefore, the analysis spanned 21 months, with periods of six months separating the three quarters being analyzed. During this period, there were several occurrences that could positively affect the efficiency of SA. The AI engine (the DNN) was retrained to refine proposed solutions, new audiological solutions were added, the user interface was improved, and a new hearing aid platform — Signia Augmented Experience (AX) — was introduced. The analysis included a subsample of 58,765 different hearing wearers who had used SA during one or more quarters.
Our analysis did not include solutions to streaming problems, since this option was not introduced until late in the period analyzed. In addition, our analysis did not consider the degree of hearing loss, nor did it distinguish among the types of hearing aids worn. Data from different hearing loss categories and different hearing aid platforms and price points consequently were pooled. The analysis did not consider how frequently SA has been used by the individual wearer, and it therefore includes data from wearers who used SA just once, as well as data from wearers who used it multiple times. Further, the analysis includes pooled data samples from around the world without considering possible regional differences.
Acceptance Rates for Solutions to Specific Problems
We examined the acceptance rates for solutions to problems within the “sound quality” and “own voice” categories. For sound quality problems, SA distinguishes between “general sound,” “loud sound,” and “soft sound,” where the wearer can state that the sound is either “dull,” “sharp,” “too loud,” or “too soft.” For own-voice problems, the wearer can indicate the sound of own voice as being either “nasal,” “too loud,” “too soft,” or “unnatural.”
The bars in Figure 3 show the acceptance rates for the solutions provided to each specific problem, for each of the three quarters included in the analysis. The points (connected by black lines) in the plot show the share of the wearers using SA who reported a specific problem in each of the three quarters. For example, in 2021-Q1, 22% of the wearers using SA reported general sound being dull, and in those cases, 70% of the solutions suggested by SA were accepted. In 2021-Q4, the share of wearers reporting the same problem also was 22%, whereas the acceptance rate increased to 74%. In 2022-Q3, the share of wearers was slightly higher (23%), and the acceptance rate had increased to 77%.
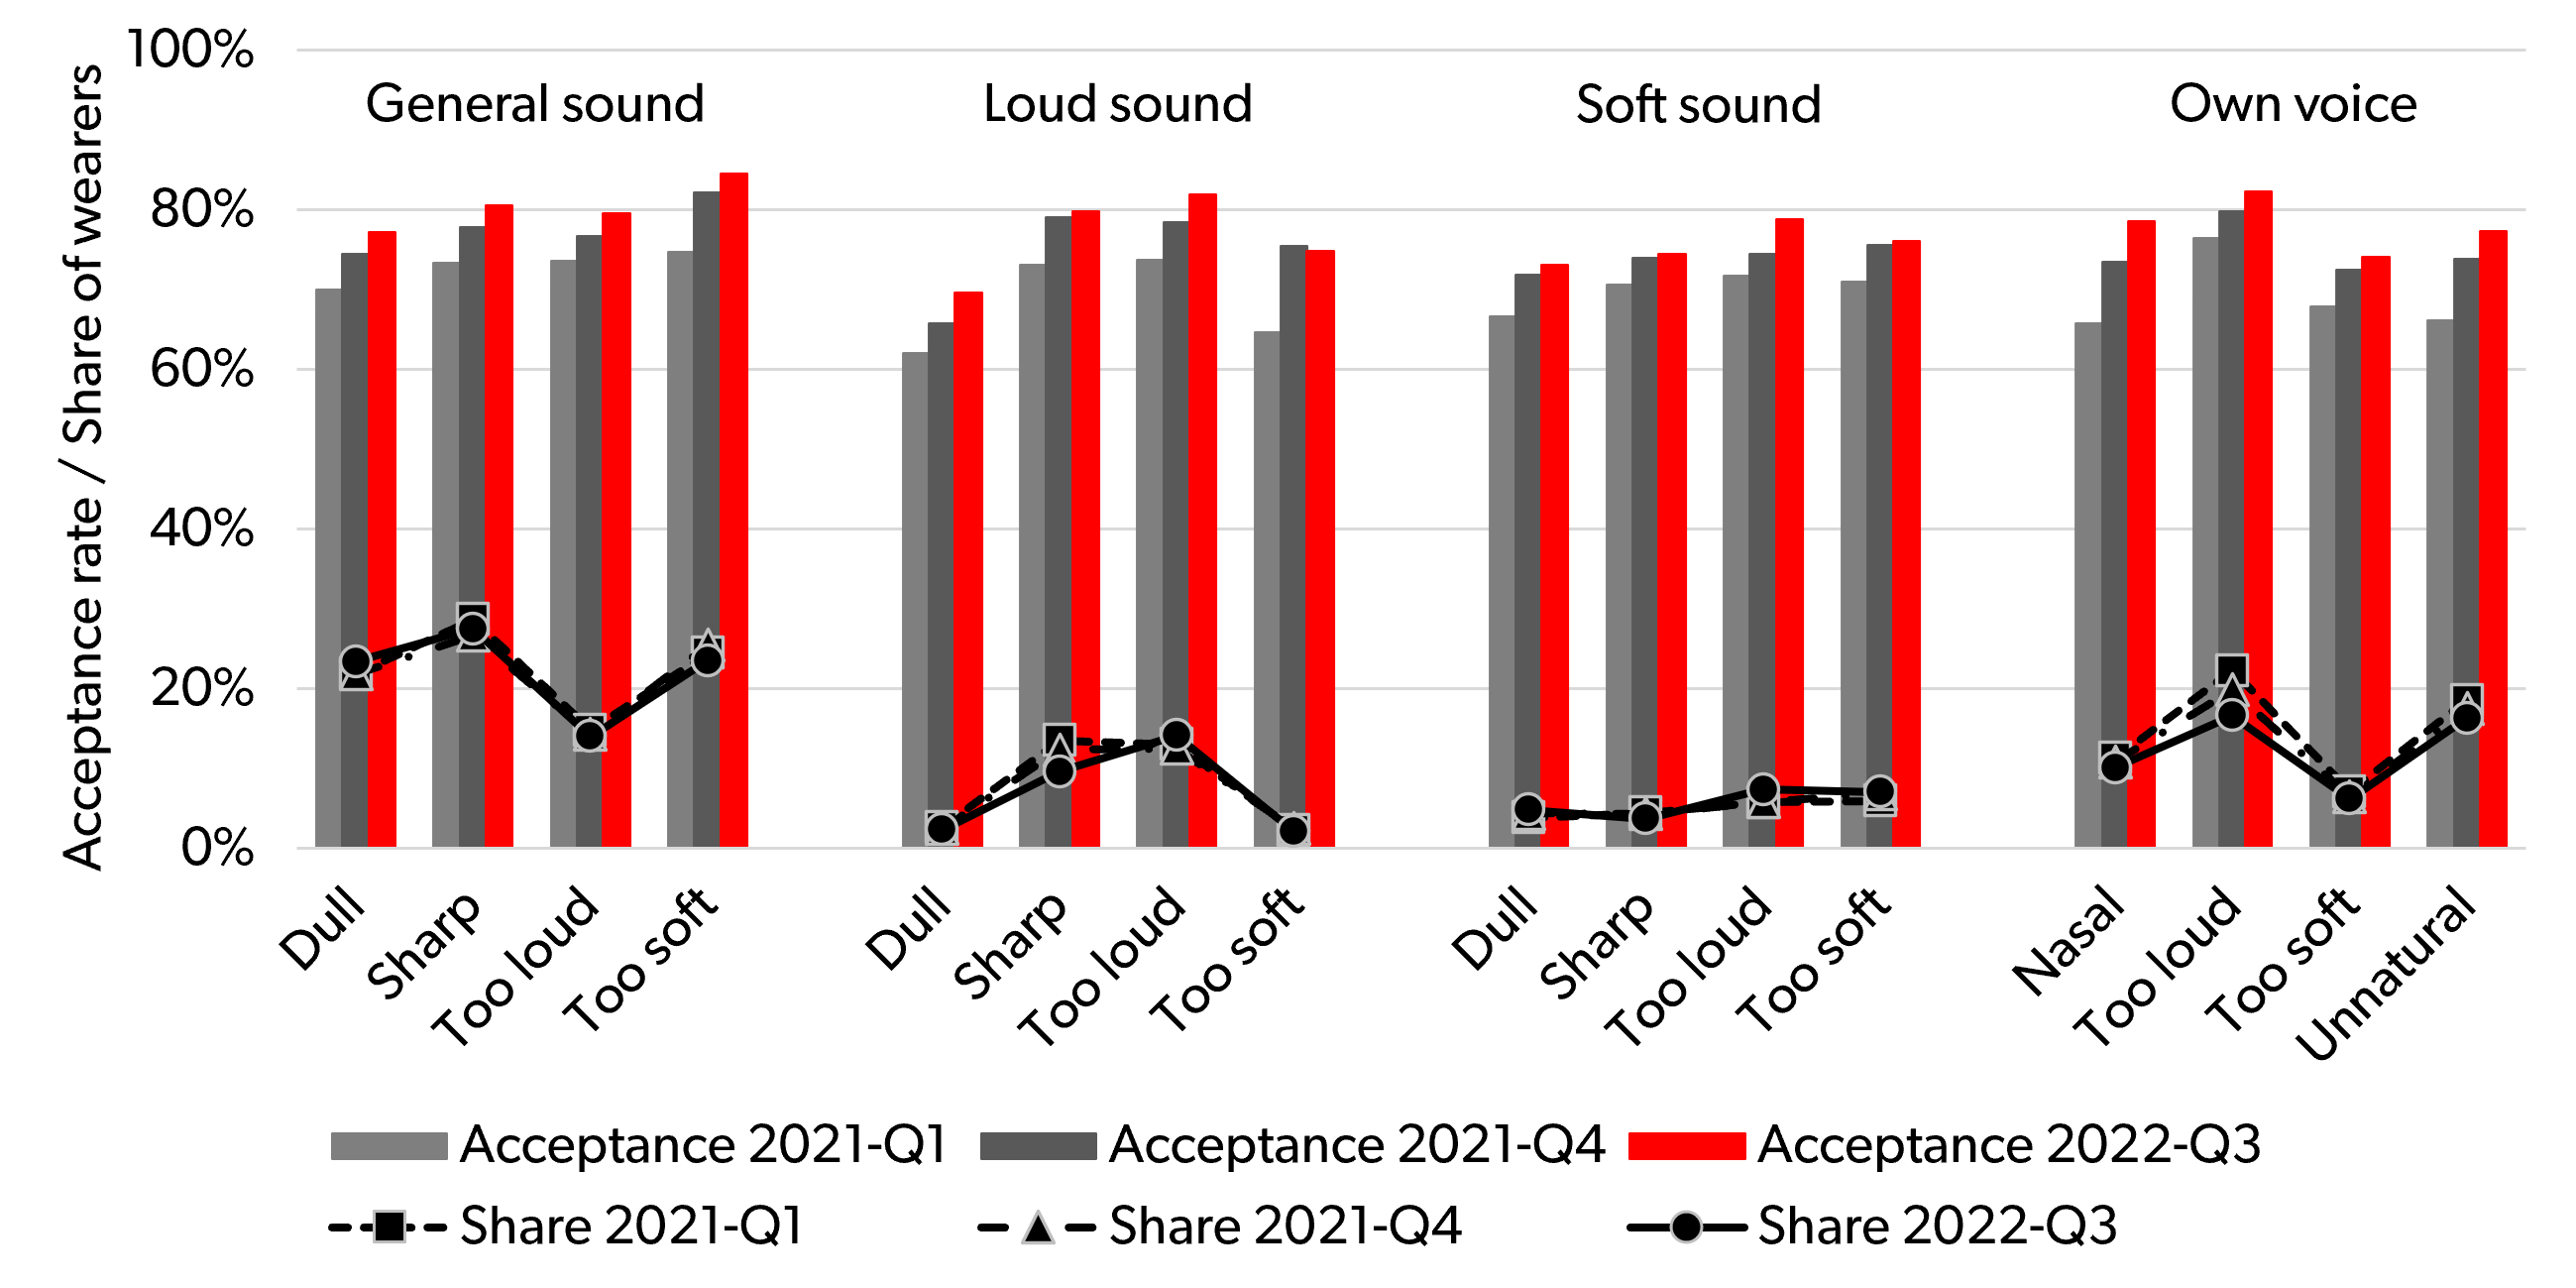
Figure 3. The bars show the acceptance rates, for the three included quarters, for solutions to problems where wearers reported the sound to be either “dull,” “sharp,” “too loud,” “too soft,” “nasal,” or “unnatural” within the categories “general sound,” “loud sound,” “soft sound,” and “own voice.” Furthermore, the points (connected with dotted and full lines, respectively) indicate the shares of wearers using Signia Assistant who reported the specific problems in each of the three quarters.
Some general trends are easily observed in Figure 3. One, the acceptance rate of solutions is quite high for all the different types of problems related to sound quality and own voice. Most acceptance rates are above 70%, and the highest acceptance rates exceed 80%. This shows how SA’s suggested solutions are well-accepted by wearers. Two, the acceptance rates increased over time. In most (15/16) cases, there is an increase from quarter to quarter. Only in one case (loud sound being too soft), a very small decline (0.5 percentage point) is observed from 2021-Q4 to 2022-Q3. In all the other cases, the steady increase in acceptance rate clearly shows how the performance of SA has improved over time as more data has been fed into the SA system.
Three, as noted in Figure 3, the share of wearers reporting a given problem remains similar across the three quarters, as indicated by the almost coinciding points and connecting lines. This probably will not be surprising to most hearing care professionals. While hearing aid technology is updated and improved on a regular basis, the distribution of problems reported by hearing aid wearers changes slowly, and within a 21-month period, a major change in the distribution of problems would not be expected.
The only noticeable (but still minor) change observed in Figure 3 is for the problem of own voice being too loud, where the share of wearers reporting the problem dropped from 22% in 2021-Q1 to 17% in 2022-Q3. There could be various reasons for this, but more widespread use of the Own Voice Processing (OVP) technology (Froehlich et al., 2018), which addresses this exact problem, is one likely explanation of why the share of wearers reporting it in SA is declining. Additionally, an update of the OVP technology was introduced during the period investigated, which also could have addressed this specific problem (Jensen et al., 2022).
Looking at the differences between shares of wearers reporting problems, it is unsurprising that some problems are reported much more frequently than others. The most frequently reported problem is about general sound being sharp, which in 2022-Q3 was reported by 27% of the wearers who used SA. In comparison, the problem of loud sounds being too soft was only mentioned by 2% of wearers.
Figure 4 shows similar data for the third overall problem category, “other voices.” In this category, SA distinguishes between “voices in general,” “loud voices,” “soft voices,” and “rear voices,” where the wearer can report them as either “incomprehensible,” “sharp,” “too loud,” or “too soft.”
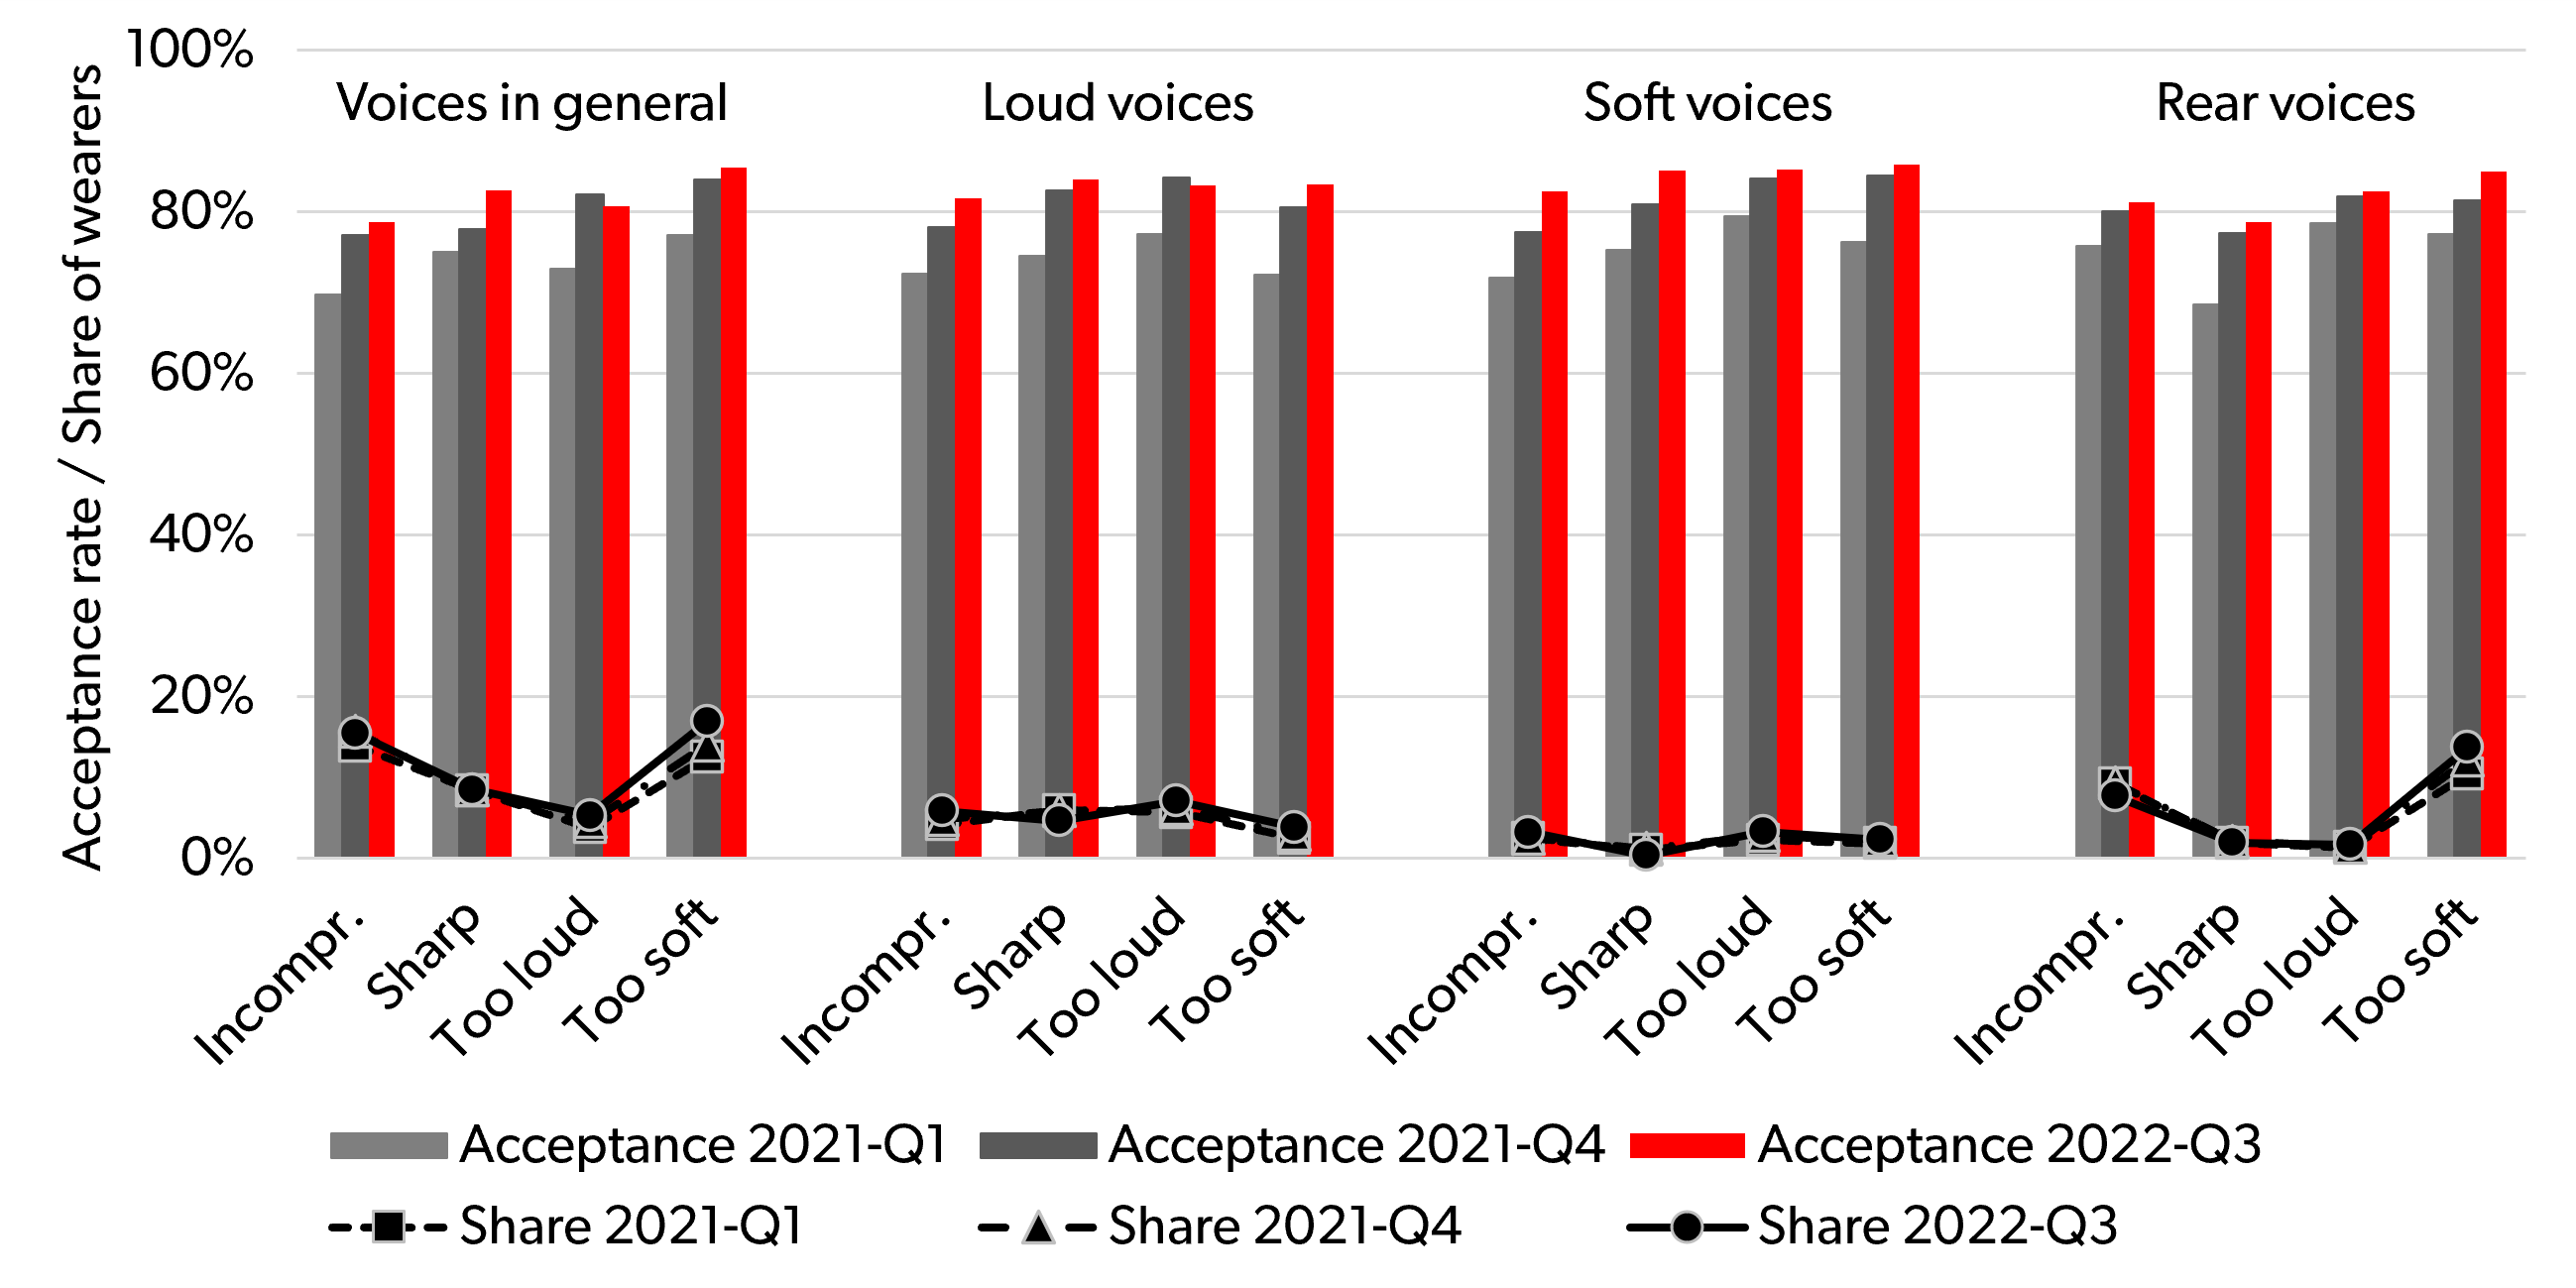
Figure 4. Similar plot as in Figure 3, showing acceptance rates for solutions to problems where wearers reported other voices to be either “incomprehensible,” “sharp,” “too loud,” or “too soft” within the overall categories “voices in general,” “loud voices,” “soft voices,” and “rear voices,” and showing the shares of wearers using Signia Assistant who reported the specific problems.
The data on “other voices” displayed in Figure 4 show the same overall trend as observed in the plot of the “sound quality” and “own voice” data (Figure 3). The acceptance rates are generally high – even slightly higher than in Figure 3 – and, with just a few minor exceptions, they steadily increase from quarter to quarter. Furthermore, the share of wearers reporting the problems is quite stable across quarters. Similar to Figure 3, there is large variation in how frequently the different types of problems are reported, with shares of wearers reporting a given problem ranging from 0.3% (soft voices being sharp) to 17% (voices in general being too soft).
Figure 5 aggregates the data from Figure 3 and Figure 4. It shows the overall acceptance rates within each of the problem categories: “sound quality,” “own voice,” and “other voices.” Note that the three categories have been pooled to show the overall acceptance rate across all types of problems. Like the other figures, the acceptance rates and the share of wearers reporting the problems are plotted for each of the three quarters. When calculating the overall (“total”) results, the share of wearers will be, by definition, 100%, since it includes all the wearers using SA in each quarter.
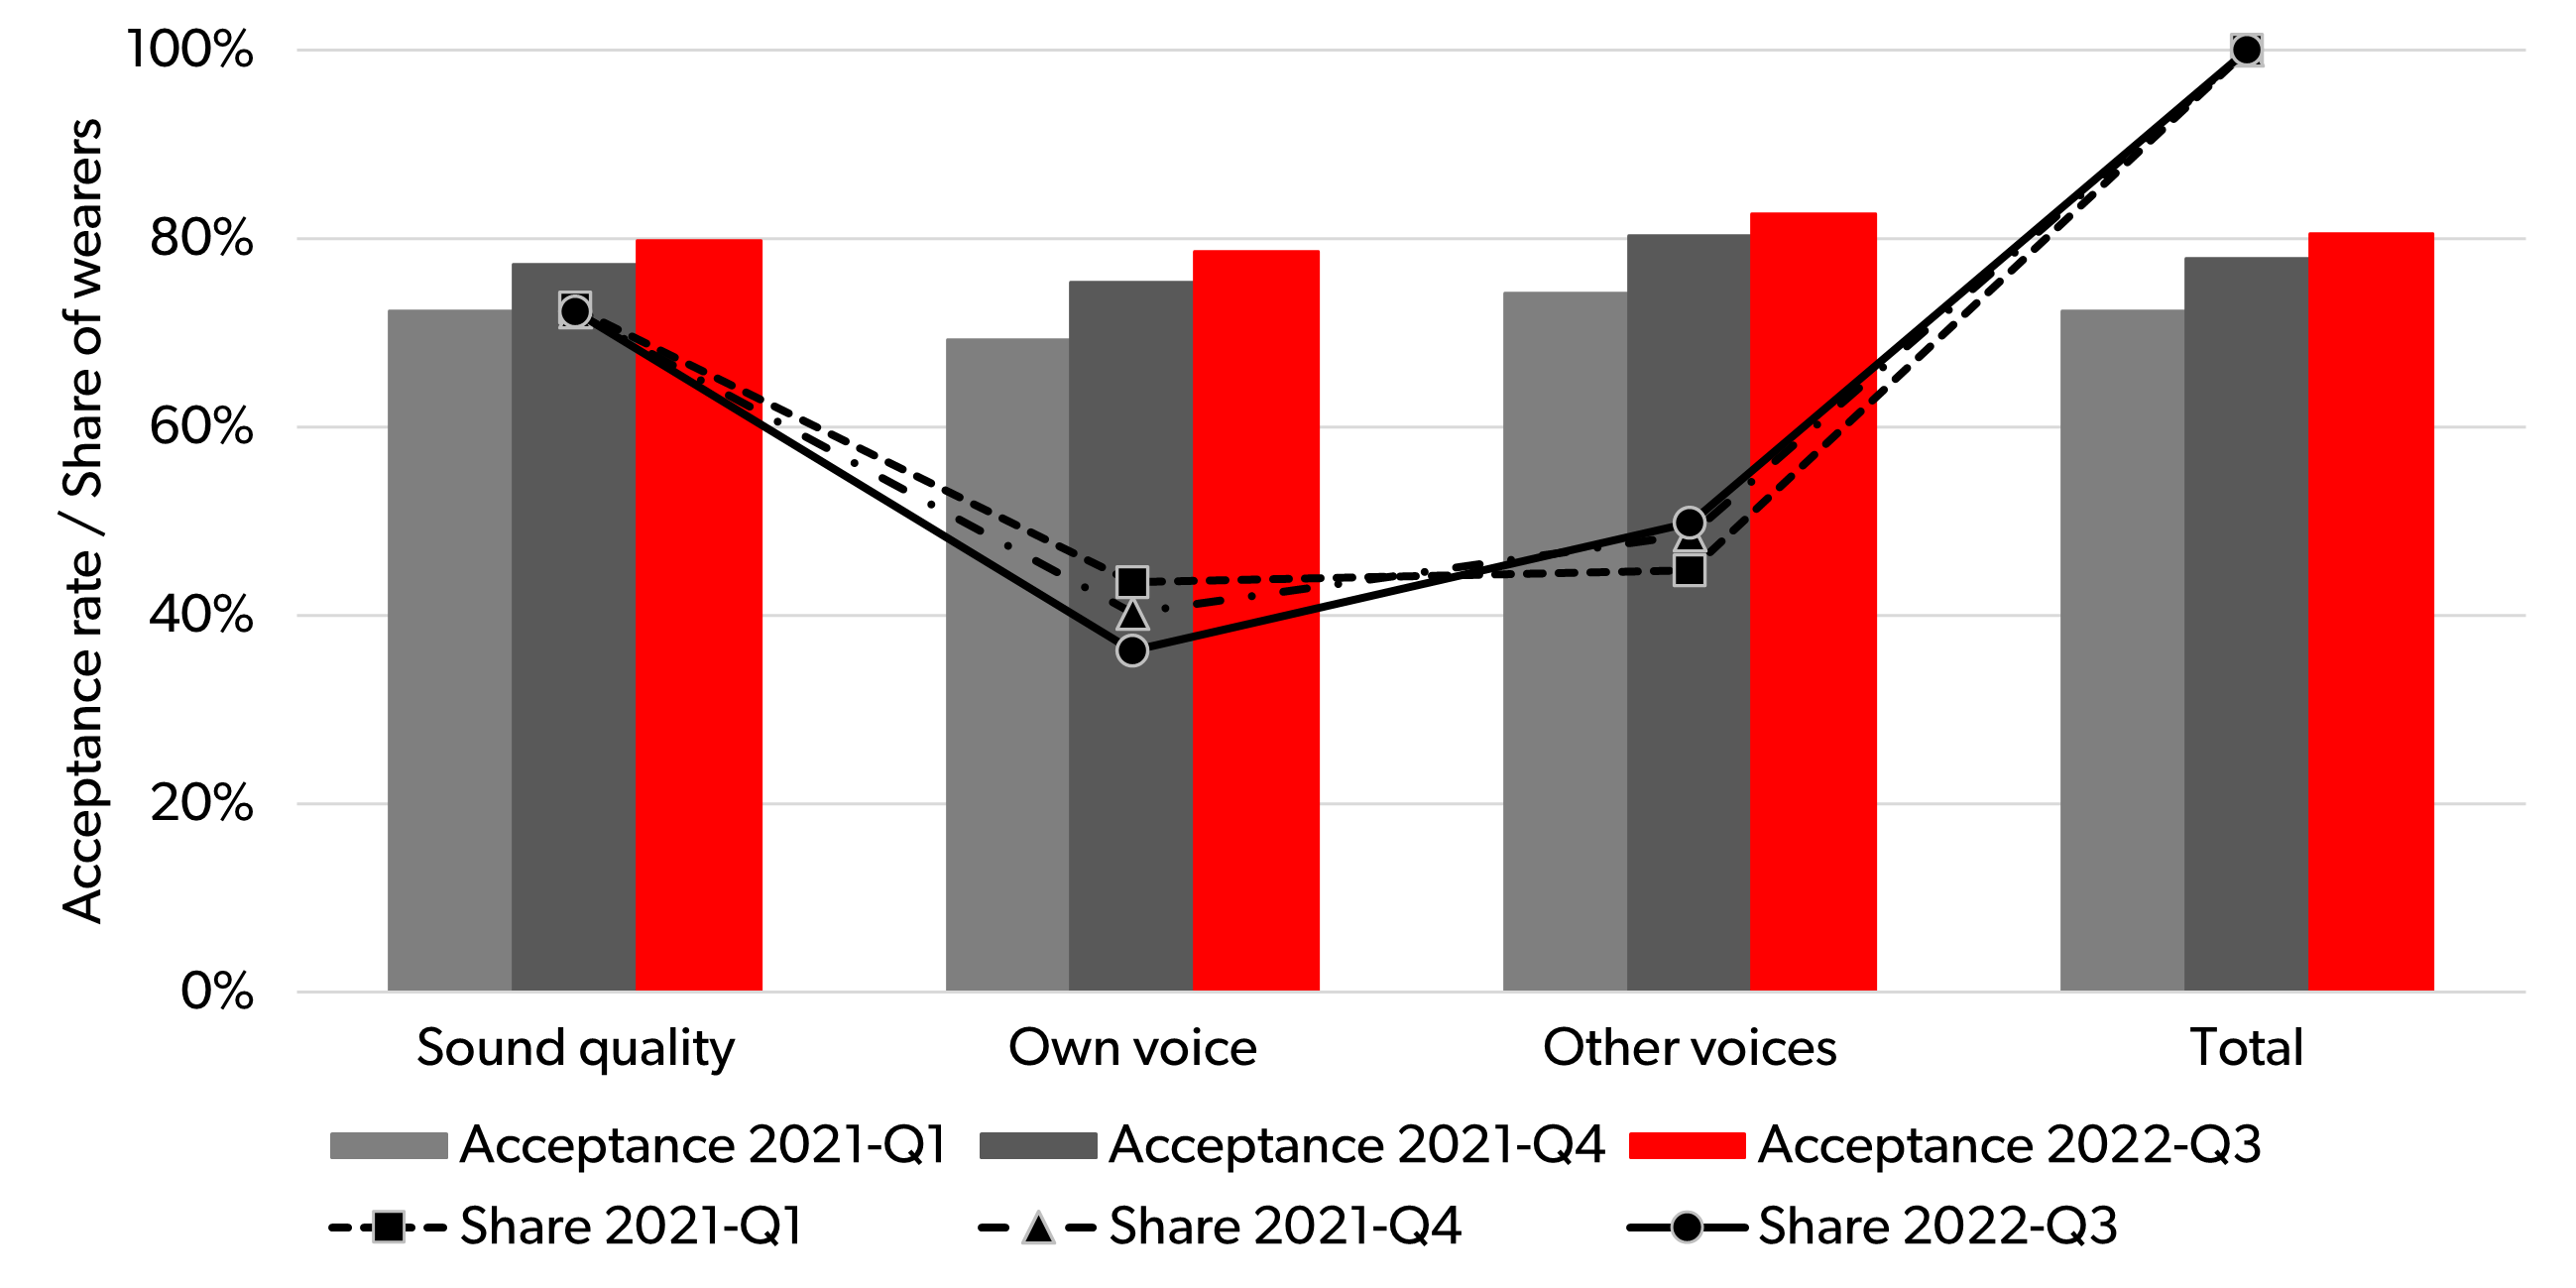
Figure 5. Aggregate acceptance rates and share of wearers reporting problems, pooling results from Figure 3 and Figure 4 into the overall domains “sound quality,” “own voice,” and “other voices.” “Total” shows the aggregate results across all three domains.
Since the overall trends were the same in Figure 3 and Figure 4, these trends – high acceptance rates increasing over time – can also be observed in Figure 5. From 2021-Q1 to 2022-Q3, the total acceptance rate increased from 72.3% to 80.5%, that is, an increase of 8.2 percentage points, which corresponds to an 11% increase in acceptance rate and a 30% decrease in rejection rate (from 27.7% to 19.5%). The change in acceptance rate over the period is statistically significant, according to a two-sample proportion (binomial) test (Z = 18.08, p < .001).
The shares of wearers reporting problems show that the most frequently reported problems are sound quality-related problems, which are reported by 72%-73% of the wearers who used SA. In the two other categories, “own voice” and “other voices,” the shares vary between 36% and 50%. While the share of wearers reporting sound quality problems was very stable across the three quarters, there was a slight drift in the shares for the two other categories. The share of wearers reporting an own-voice problem decreased slightly (from 43% to 36%), while the share of wearers reporting a problem with other voices slightly increased (from 45% to 50%).
Acceptance Rates for Specific Solutions to One Given Problem
In the data presented so far, we have examined how well SA is able to solve different types of problems, without considering the specific fine-tuning solutions applied and, specifically, the fact that different solutions are suggested for the same problem when experienced by different wearers.
As an example, let’s look more closely at the solutions suggested by the SA to solve the most reported problem: general sound being sharp (cf. Figure 3). To solve this problem, the SA has offered more than 40 different fine-tuning suggestions, or specific changes in hearing aid parameter settings. We examined the solutions that had been suggested to at least 1% of the wearers who reported the problem in each of the two quarters.
In Figure 6, data for the seven solutions that were suggested most frequently in 2022-Q3 are shown – with simplified descriptions of the solutions indicated as labels on the x-axis. For each solution and for each of two quarters, 2021-Q1 and 2022-Q3, the plot shows the acceptance rate and the share of wearers reporting the problem who received the given solution. It should be noted that the same wearer may have reported the same problem more than once and received different solutions, which explains why the shares of wearers do not sum to 100% (but rather a higher number) across all the solutions. In the plot, the solutions are ordered according to how frequently they were suggested in 2022-Q3.
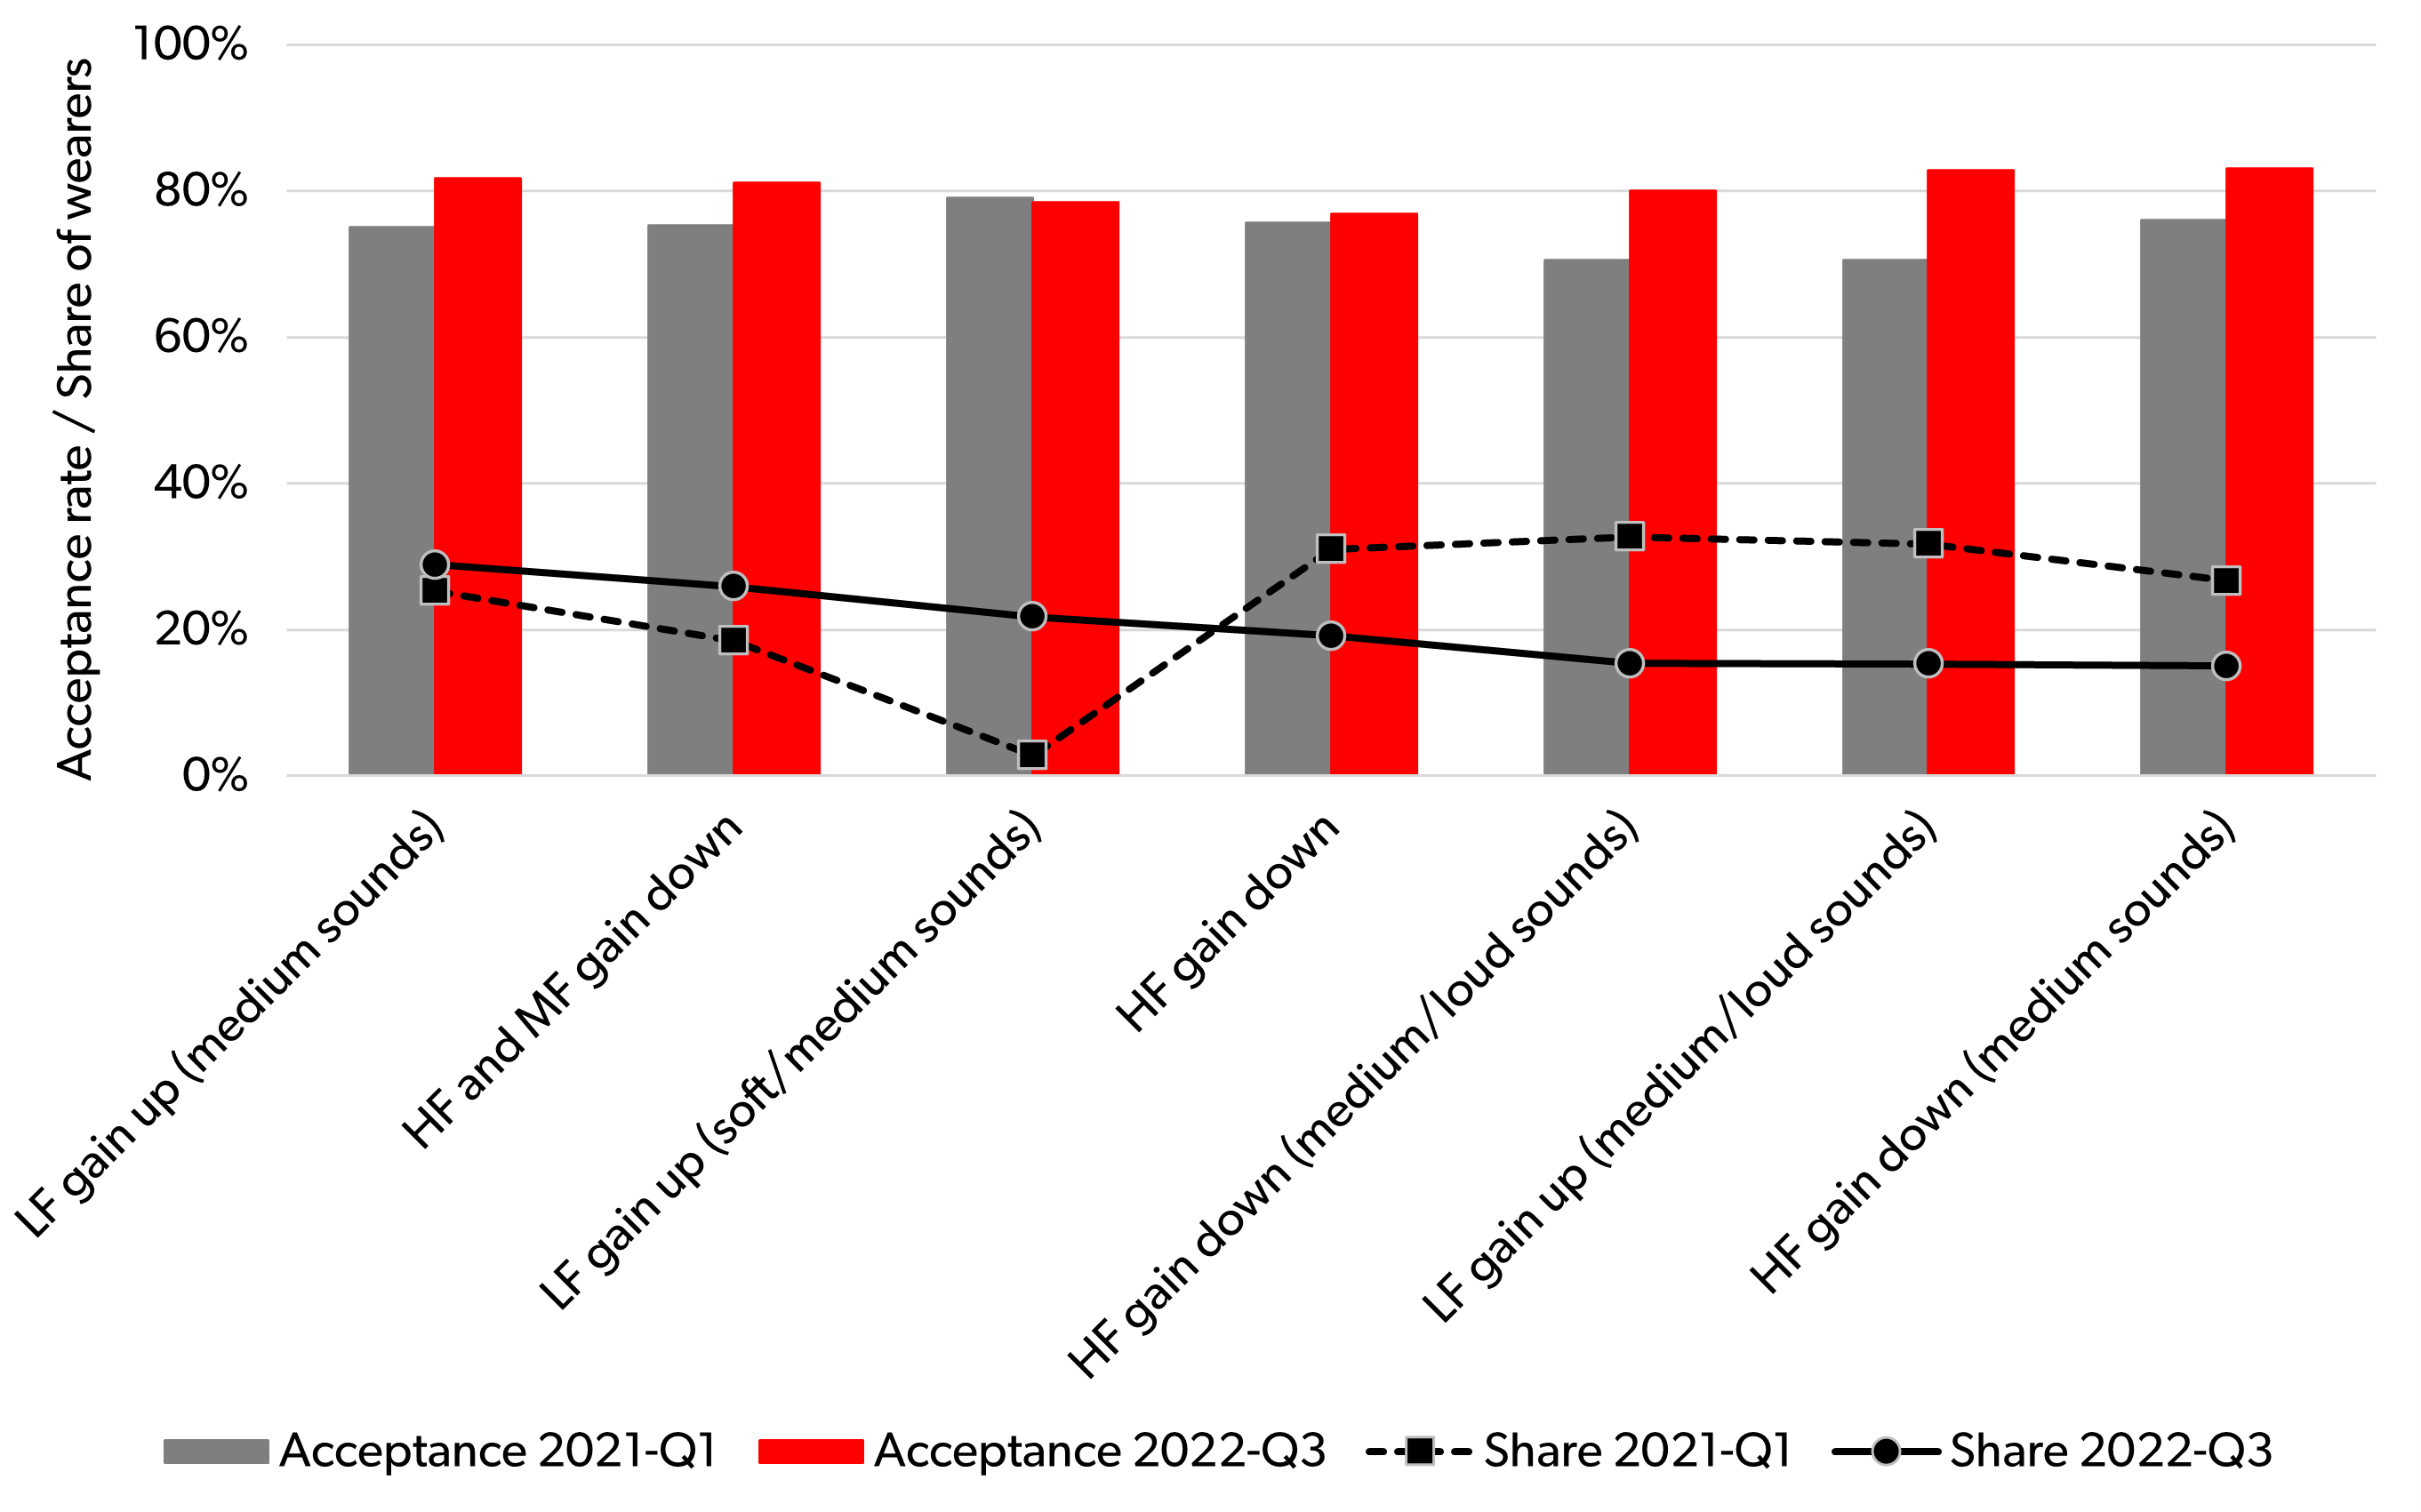
Figure 6. Acceptance rates for specific solutions to the problem of general sound being sharp, in 2021-Q1 and 2022-Q3, and the share of wearers reporting this problem who received a given solution in each quarter.
One trend in Figure 6 is apparent: The acceptance rate for the various solutions generally increases from 2021-Q1 to 2022-Q3. This would be expected based on the results for this problem already presented in Figure 3. For five of the seven solutions, the increase is clear, while the difference in acceptance rates is quite small for the last two solutions.
While the distribution of problems reported by wearers was rather stable over time (cf. Figure 3 and Figure 4), an important observation to make in Figure 6 is that the distribution of applied solutions – both for the example shown and for the solutions suggested for other problems – changed substantially between 2021-Q1 and 2022-Q3. This can be directly attributed to the change in the core of SA, made between the two quarters.
Based on all the available data on acceptance and rejection of the different solutions across situations and wearers, the DNN was retrained, which resulted in a different prioritization of the solutions provided. This is clearly illustrated by the last four solutions plotted in Figure 6. It indicates that in 2021-Q1, each of these four solutions was suggested to around 30% of the wearers reporting the problem, while in 2022-Q3 this share dropped to around 15%–20%. However, in all four cases, the acceptance rate increased at the same time. This shows how SA has improved its ability to predict when the given solution will work, providing a better solution to the individual wearer.
Another interesting finding is that the solution applied third-most frequently in 2022-Q3 (to 22% of the wearers reporting the problem) was suggested in 2021-Q1 to just 3% of the wearers reporting it. In this case, the high acceptance rate of almost 80% observed in 2021-Q1 made the DNN suggest this solution much more frequently in 2022-Q3 — and still with a very high acceptance rate. This finding further demonstrates that as SA pools more data, its ability to predict an acceptable solution improves.
Finally, the solution descriptions provided in Figure 6 show how completely different approaches are used to solve the same basic problem. The problem-solving may involve gain changes – up or down – in different frequency ranges and at different input levels (to adjust compression). This reflects the fact, known by all hearing care professionals, that the right solution for one wearer may be very different from the right solution for another wearer. This is acknowledged by SA, which not only takes the problem description into account, but also considers the situation detected by the hearing aid and the personal characteristics of the wearer, including previous preferences expressed via use of the system.
Discussion
The data presented in this article demonstrate that SA improves its performance over time, as indicated by steadily rising acceptance rates over 21 months of hearing aid use. The time frame under investigation included additions of new audiological features and retraining of the DNN (using previously collected data), both of which are believed to have improved system performance. Additionally, since some of the individual wearers contributed to all three quarters investigated, these individual learning effects have been included in the data and are believed to contribute to the performance improvements measured over time. Finally, a new hearing aid platform, Signia AX, was launched during the study period, and the new type of signal processing and its associated benefits offered by this platform (split-processing; Jensen et al., 2021) provides additional enhancements for SA to solve problems.
An obvious question to ask is, will wearer acceptance rates that result from the use of SA continue increasing steadily, ultimately reaching 100%? The honest answer is that while some further improvements indeed are possible, largely driven by further enhancements of machine learning methods and hearing aid technology, this trend of steadily rising wearer acceptance rates will most likely flatten out before it reaches 100%. After all, no two wearers are alike. Everyone has unique communication demands, finds themselves in highly variable listening situations and reacts to these challenges in different ways. Therefore, there will always be individual wearers who deviate from what large data sets like those gathered by SA can predict. However, it is quite impressive that we can now observe acceptance rates exceeding 80%. It is a clear indication of how AI, when applied in the right way, provides more precise adjustment options for the individual wearer – a task at times seemingly impossible to achieve through the traditional in-person fine-tuning appointment, where questions and answers often serve as the foundation for adjusting hearing aids.
The overall acceptance rate of 80.5% observed in the final quarter of this investigation suggests that SA in 80.5% of the use cases can predict an appropriate adjustment of the hearing aids. This indicates how SA can be used to effectively assist the HCP in establishing the optimal fitting for individual wearers. The ability of SA to serve as a sort of copilot is quite similar to how AI is used in other fields. For example, in dermatology, use of AI methods to detect skin diseases can provide a substantial increase in the detection rate compared to human performance, allowing physicians to be more precise in their diagnoses.
In this article, we examined only the problem-solving options available in SA since its launch. Since then, the system has been updated in different ways. For example, wearers can now address problems experienced during audio streaming, and in the future, new updates may address other types of listening problems experienced by wearers. Further, the underlying machine learning approach may be further improved via additional retraining of the DNN. Thus, the SA is not a static feature but a dynamic live tool that keeps improving continuously.
For HCPs, having information from SA through the fitting software provides precise data-driven insights on the performance and individual preferences of the wearer – a level of personalization not available until now. This level of personalization of the hearing aids’ parameter settings, placed in the hands of the wearer with some basic guidance from the HCP, can change how hearing aids are fitted. Signia Assistant represents a shift in focus during the all-important initial use of hearing aids and associated follow-up appointments. A shift away from impromptu fine-tuning appointments allows more time for personalized coaching and counseling, so wearers know how to maximize wireless streaming, how to use wellness apps and to understand the SA system itself, and this can lead to higher levels of wearer satisfaction (Picou, 2022). In this way, SA contributes to increased empowerment for the wearer and the HCP.
Summary
In this article, we have described how the use of artificial intelligence in the Signia Assistant is able to support hearing aid wearers in their everyday lives, in every instance where an adjustment of the hearing aids is desired. It allows for a fully personalized fitting, not being tied to an audiogram or an ad hoc fine-tuning process but taking individual circumstances and preferences into account to reach the optimal solution for an individual wearer.
The data presented here show that use of SA leads to a remarkably high acceptance rate. What’s more, the acceptance rate has steadily increased over time, with the overall acceptance rate across all solutions going from 72.3% to 80.5% during the observed 21-month period.
Several possible reasons account for this increase in wearer acceptance:
- enhancements of the DNN (learning from new wearer data from around the world constantly entering the SA),
- SA’s ability to learn individual wearer preferences with repeated use of it,
- improvements in the SA user interface, and
- the introduction of a new hearing aid (Signia AX) platform, which allowed new and improved adjustment options to be implemented in SA.
The data also show how SA provides solutions in a variety of listening situations and offers help to solve common and isolated problems for many of the wearers who report them.
In conclusion, this article demonstrates how a wearer-controlled AI system can be used in the hearing aid fitting process and how it contributes to higher acceptance rates. Signia Assistant is a dynamic tool that improves over time. It provides direct support to the wearer and provides the HCP, who has full access to all the fine-tuning adjustments suggested and accepted by the wearer, with a new approach to the hearing aid fitting and adjustment process. Thus, Signia Assistant empowers not only the wearer but also the HCP.
References
Anderson, M. C., Arehart, K. H., & Souza, P. E. (2018). Survey of current practice in the fitting and fine-tuning of common signal-processing features in hearing aids for adults. Journal of the American Academy of Audiology, 29(2), 118-124.
Froehlich, M., Powers, T. A., Branda, E., & Weber, J. (2018). Perception of own voice wearing hearing aids: Why "natural" is the new normal. AudiologyOnline, Article 22822.
Høydal, E. H., & Aubreville, M. (2020). Signia assistant backgrounder. Signia White Paper.
Høydal, E. H., Aubreville, M., Fischer, R. L., Wolff, V., & Branda, E. (2020). Empowering the wearer: AI-based signia assistant allows individualized hearing care. Hearing Review, 27(7), 22-26.
Høydal, E. H., Jensen, N. S., Fischer, R. L., Haag, S., & Taylor, B. (2021). AI assistant improves both wearer outcomes and clinical efficiency. Hearing Review, 28(11), 24-26.
Jensen, N. S., Høydal, E. H., Branda, E., & Weber, J. (2021). Improving speech understanding with Signia AX and augmented focus. Signia White Paper.
Jensen, N. S., Pischel, C., & Taylor, B. (2022). Upgrading the performance of Signia AX with auto echoShield and own voice processing 2.0. Signia White Paper.
Jenstad, L. M., Van Tasell, D. J., & Ewert, C. (2003). Hearing aid troubleshooting based on patients' descriptions. Journal of the American Academy of Audiology, 14(07), 347-360.
Picou, E. M. (2022). Hearing aid benefit and satisfaction results from the MarkeTrak 2022 survey: importance of features and hearing care professionals. Seminars in Hearing, 43(4), 301-316.
Taylor, B., & Høydal, E. H. (2023). Machine learning in hearing aids: Signia’s approach to improving the wearer experience. AudiologyOnline, Article 28495.
Wolf, V. (2020). How to use Signia Assistant. Signia White Paper.
Citation
Jensen, N., Taylor, B., & Müller, M. (2023). AI-based fine-tuning: how Signia assistant improves wearer acceptance rates. AudiologyOnline, Article 28555. Retrieved from https://www.audiologyonline.com


