 From the Desk of Gus Mueller
Come gather ’round people, wherever you roam
And admit that the waters, around you have grown
And accept it that soon, you’ll be drenched to the bone
If your time to you is worth savin’,
Then you better start swimmin’ or you’ll sink like a stone
For the times, they are a-changin’
Who knew that back in 1964, Bob Dylan was writing about hearing aids? Indeed, the times are changing. Major hearing aid manufacturers are gobbling up retail offices, Costco continues to expand its dispensing services, CVS has entered the hearing aid dispensing arena, and the products themselves have entered into some interesting marriages with our smart phones. And then of course, we have this OTC issue looming in the background.
Whether the hearing aids come from a university medical center or the neighborhood drug store, what really matters at the end of the day is that the gain and output for the patient has been individually optimized in the ear canal. As professionals, that’s what we do best, and that’s what we’re talking about in this month’s 20Q.
Gus Mueller, PhD
Contributing Editor
November 2017
Browse the complete collection of 20Q with Gus Mueller CEU articles at www.audiologyonline.com/20Q
20Q: Hearing Aid Verification - Can You Afford Not To?
Learning Outcomes
After this course, readers will be able to:
- Describe key concepts regarding the selection of hearing aid gain and output.
- Explain the methods to assure that appropriate hearing aid gain and output are present for each patient.
- Describe the potential negative outcomes that could occur if appropriate hearing aid gain and output are not achieved.
- Explain why hearing aid verification is more critical than ever in today's changing hearing aid market.
1. Let’s start with the basics. Exactly what do you mean by verification, and how is that different from validation?
It’s true that if you simply look up the definitions of verification and validation, you’ll find them to be very similar. But in the world of quality control (and the fitting of hearing aids) they tend to mean different things. As described in our recent book (Mueller, Ricketts, & Bentler, 2017), verification typically is used when discussing if specific design goals were met, whereas validation is used to describe whether the end user obtained what they wanted or needed. Simply put:
- Verification: Are we building the system right?
- Validation: Are we building the right system?
I find an easy way to remember the differences between the two terms is to think about my mom’s chocolate chip cookies.
2. What does verification and validation have to do with chocolate chip cookies?
Bear with me - most everyone has fond memories of their mom’s chocolate chip cookies. Let's say that one Saturday afternoon you decided to make some cookies just like mom used to make. Luckily, you have her recipe. You follow it very carefully, putting in exactly the right amount of each of the nine different ingredients, and baking them for precisely 10 minutes at 375 degrees. All of that is verification. Are you building the system (cookie, hearing aid) right? Validation is when you take the first bite of the finished product.
I do need to point out the obvious: to verify something, you need a standard or goal to verify against. In this case it was a recipe.
3. What is the gold standard recipe for fitting hearing aids?
We actually have several goals when we fit hearing aids, including good audibility, optimizing speech understanding, appropriate loudness, good sound quality, and a fitting that is acceptable to the average patient. Fortunately for us, smart people have put all these fitting goals into a pot, stirred them up, and created a reasonable blending that can be tailored to individual patients based on their hearing loss. Of course, I'm referring to prescriptive fitting approaches, and today we have two well-validated methods, the NAL-NL2 and the DSLv5. I reviewed the underlying rationale for the use of prescriptive methods in a previous 20Q (Mueller, 2015) so I won’t go into it again here.
I do want to remind you that the verification of hearing aid fitting - that is, verifying that the gain and output is correct and that the fitting passes the “quality control measure” - only can be accomplished using probe-microphone measures. To be clear, verification is not simply putting a probe tube in the patient’s ear canal, saying a few words to patient, and then commenting on the ear-canal output displayed on the equipment monitor. Verification involves using validated prescriptive targets (NAL-NL2 or DSLv5) displayed via the probe-mic equipment, matching output to these targets using a calibrated LTASS (long term average speech spectrum) input signal (e.g., the ISTS; Holube, 2015), delivered at soft, average and loud levels.
Many audiologists are making a big mistake by not embracing the verification process. It’s what makes us stand above the crowd, and separates “fitting hearing aids” from simply “dispensing hearing aids.” I believe the verification process (or absence of it) will become even more critical in the near future, as we see the roll-out of over-the-counter (OTC) hearing aids, and on a different front, the probable move to an unbundling pricing structure.
4. This whole OTC hearing aid thing has seemed to happen pretty fast?
Not really. The OTC hearing aid issue has been brewing for quite a few years, at least back to 2009. That's when the NIDCD sponsored the Working Group on Accessible and Affordable Hearing Health Care for Adults with Mild to Moderate Hearing Loss. You're somewhat right, as things have heated up quickly the last year. On December 1, 2016 the first introduction of the Warren/Grassley Over the Counter Hearing Aid Act was introduced. This bill was reintroduced in March 2017 (S.670 and H.R.1652). H.R.1652 passed as part of the FDA Reauthorization Act of 2017 in July 2017, and S.670 passed (identical to HR1652) on August 3, 2017. It was signed by the President on August 18, 2017. During this general timeframe, some important meetings were also happening that impacted the landscape: two 2015 meetings of the President’s Council of Advisors on Science and Technology (PCAST); the 2016 meeting of the National Academies of Sciences, Engineering and Medicine (NASEM) task force: Hearing Health Care for Adults: Priorities for Improving Access and Affordability; and, the April 2017 meeting of the Federal Trade Commission (FTC) entitled, Now Hear This: Competition, Innovation and Consumer Protection Issues in Hearing Health Care.
5. Will we be seeing OTC hearing aids soon? And what kind of products are they?
At present, the products don’t exist, so we don’t know what they will be like, and they may vary considerably. In some cases, it might be more than just a product, but rather some kind of system. According to the OTC Hearing Aid bill, part of the definition of an OTC device is one that “through tools, tests, or software allows the user to control the OTC hearing aid and customize it to the user's hearing needs, and that may include tests for self-assessment.”
Exactly when OTC hearing aids will be available is uncertain. The new legislation mandates the FDA to establish an OTC hearing aid category within 3 years of passage of the legislation (recall that the legislation passed in August 2017), and finalize a rule within 180 days after the close of the comment period. I’ve heard some insiders say that it’s going to happen fast, like in 2018. On the other hand, a recent report from the American Academy of Audiology, following a meeting with FDA representatives, stated that the FDA anticipates that the rulemaking process is likely to take the full three years.
6. I know you’re stressing the importance of verification, but what about that big study that found that OTC hearing aids without verification provided the same benefit as premier hearing aids that were verified using probe-mic measures?
You are no doubt talking about the findings from the NIH-funded study from Larry Humes and colleagues that came out last spring (Humes et al., 2017). This study looked at efficacy of hearing aids in older adults and compared those fit using audiology best practices versus those obtained via an alternative OTC approach.
Indeed, it did generate a lot of press, including this headline from the NIDCD online newsletter: “Model approach for over-the-counter hearing aids suggests benefits similar to full service purchase.” Let me first point out, that the OTC dispensing approach used in this research was very different from one where the consumer simply heads to aisle 7 of their neighborhood pharmacy or big box store to buy hearing aids.
The “counter” was at a major university clinic, 135 (41%) of the potential participants were rejected, and the hearing aids were premier open fit RIC hearing aids from a major manufacturer. The Consumer Decides group (sometimes called the OTC group) did some listening trials with three different pairs of hearing aids pre-programmed to NAL-NL2 targets for different degrees of hearing loss, and then selected what they believed was best for them.
7. But the results for this Consumer Decides group were positive, right?
Right. In general, for self-assessment inventories, they did not fall too far below the group that was fitted by audiologists using real-ear target verification. However, one thing from the article that caught my eye is shown in Figure 1 (adapted from Humes et al., 2017).
Figure 1. A comparison of the hearing aids (X, Y, or Z) selected by the participants (read horizontally) vs. the hearing aids that would be deemed appropriate based on the NAL-NL2 fitting algorithm (read vertically). Each cell represents the totals (right and left) for the 51 participants fitted bilaterally.
Figure 1 shows the combined right and left ear findings for 51 participants (102 fittings). Recall that the hearing aids were pre-programmed, so it was possible to determine which one of the three hearing ads (X, Y, or Z) would be most appropriate for each participant based on their hearing loss (read vertical on the Figure). It is then possible to compare this with what the participant selected (read horizontal on the Table). If agreement was present, the big numbers should be in the diagonal, but they are not. Note that in 63 cases the consumer picked hearing aid X, whereas, based on the NAL-NL2, this hearing aid only would have been selected for 15 of the fittings. Overall, the consumer picked the “wrong” hearing aid about 70% of the time.
8. So audiologists really are needed to ensure that patients receive an optimal fitting.
If they are conducting verification, then yes. The authors also published the average aided Speech Intelligibility Index (SII) for the Consumer Decides group. As you might guess, consumers tended to under-fit themselves, and their as-worn average SII was around .60 for average speech inputs. We’d expect an SII of approximately .66 for this degree of hearing loss for a NAL-NL2 fitting.
To put this in perspective relative to our verification topic, let’s go back to some research from a couple years ago (Sanders, Stoody, Weber, & Mueller, 2015). Using an audiogram very similar to the average audiogram in the Humes et al. study, we compared the SIIs for an NAL-NL2 fitting to that of the manufacturer’s proprietary fitting. Why the proprietary fitting? Because this is what audiologists who don’t believe in verification typically use. What we found (again, for the 65 dB input signal) is shown in Figure 2.
Figure 2. Shown are the real-ear aided SIIs (65 dB SPL input) obtained for the proprietary (default) fittings of the premier hearing aid from the five leading manufacturers. For comparison, the SII that would be obtained for an NAL-NL2 fitting also is shown (adapted from Sanders et al., 2015).
Observe that the SIIs for all the proprietary fittings are substantially below the NAL-NL2 fitting, in some cases by as much as .20. On average, the NAL-NL2 resulted in an SII of .67 and the proprietary fittings .52, which is a difference of .15. What’s my point? In the Humes et al. (2017) study, the consumers picked hearing aids over-the-counter that resulted in an SII that was closer to what was appropriate for them, than what a patient would likely obtain when they are fitted by a professional who didn’t conduct real-ear verification. Didn't I say that verification is going to separate us from the rest of the pack?
9. I get it. But you’re saying that an NAL-NL2 fitting only provides an SII of .69 or so. Shouldn’t it be higher?
For average inputs for adults with acquired hearing loss, usually no. We can look at the data from Johnson and Dillon (2011), who compared the NAL-NL2 to the DSLv5 for five different audiograms. One of things they reported was the resulting SIIs for a fit to target. The SIIs (65 dB input) ranged from .67 to .75 for the DSL, and .64 to .73 for the NAL; the overall average was .70 for the DSL and .69 for the NAL. This doesn’t mean that you should pump in gain at random frequencies until you obtain an SII of .70. What I’m saying is that if you obtain the output called for by these prescriptive algorithms for average speech, you’ll typically end up with an SII around .65 to .75.
Now—the SII rules change for pediatric fittings, and as you would expect, we are looking for a higher SII for the same hearing loss. The group at University of Western Ontario have collected normative SII data for “acceptable” pediatric fittings as a function of degree of hearing loss. You can find this useful information in the UWO Pediatric Audiological Monitoring Protocol.
10. Thanks, those SII data for children will be a handy reference. But back to adults, why isn’t bigger better, when it comes to SII?
Back at the start of this conversation, I mentioned that there are several different factors that go in to the prescriptive formulas to help to achieve our various fitting goals. Audibility is a good thing, but too much of most any good thing can be a problem. In some cases, more audibility does not lead to greater intelligibility, and in other cases, it might lead to unacceptable sound quality. One of the main driving factors is loudness.You have a loudness budget with each patient, and you have to use it carefully. For example, increasing gain in the highs will indeed likely improve the SII, but if this prompts the user to turn down overall gain, as it probably will, the resulting SII may well be lower than where you started (See Mueller, 2017 for review).
I have a basketball analogy to help explain this, which I’ve mostly stolen from a Harvey Dillon article of several years ago. You’re the coach of a nine-member basketball team about to play a big game. The ages of the players on your team are quite diverse: A 20-year-old, 30-year-old, 40-year-old, 50-year-old, 60-year-old, 70-year-old, 80-year-old, 90-year-old, and yes, one player who is 100-years-old. You pick the five youngest for your starters (which means you already have a 60-year-old out there). The team you are playing has all 20-year-olds. The age-graph of your team is shown in Figure 3.
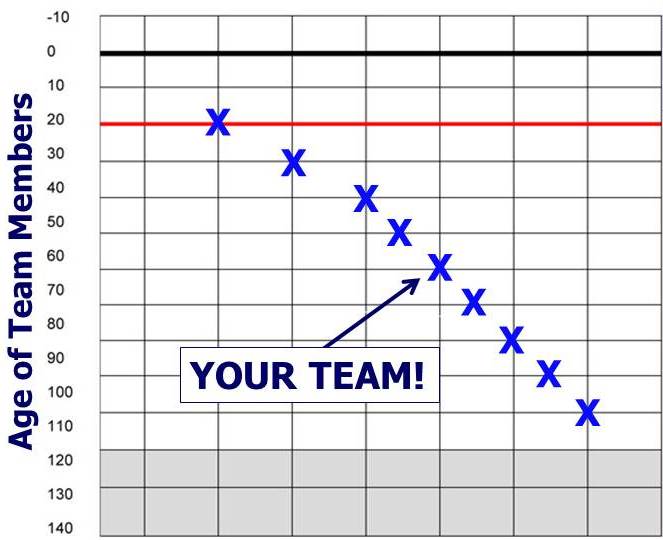
Figure 3. Plotting of the ages of your basketball team.
The first half of the game is winding down, but amazingly, you are not too far behind. But, your starting five are exhausted and fading fast. Who are you going to put in? The youngest player on your bench is a 70-year-old. Actually, all of your starting five are exhausted. Are you really going to put in your 80-year old? Your 90-year-old? Or - gasp - your 100-year-old? The answer of course, is that in nearly all cases, the best approach is to keep playing your five youngest players, just as in hearing aid fittings, you want to be playing the frequencies that contribute the most to speech understanding. If you add gain somewhere, you will probably have to subtract gain somewhere else.
11. You seem to keep promoting this “fit to target” notion, but is there really any proof that this provides a superior outcome?
Yes. I’ve talked about this in a couple of other 20Q articles (Mueller, 2014; Mueller, 2015), but new supporting evidence continues to emerge. For example, Mike Valente and colleagues (Valente, Oeding, Brockmeyer, Smith, & Kallogieri, 2017) just completed a study comparing a verified NAL-NL2 fitting to a manufacturer’s proprietary fitting using both laboratory and real world outcome measures. It makes sense to use the proprietary fitting as the comparison, as this is by far the most popular alternative fitting when verification is not conducted. The advantages that they found for the NAL-NL2 fittings was not trivial. For example, Figure 4 shows the speech recognition findings for soft speech, taken from the Valente et al. data. The data show that average speech recognition is roughly 20% better with the NAL-NL2; in fact, if you compare the box plots you see that the 25th percentile of the performance scores for the NAL-NL2 fittings exceed the 75th percentile of the proprietary fittings.
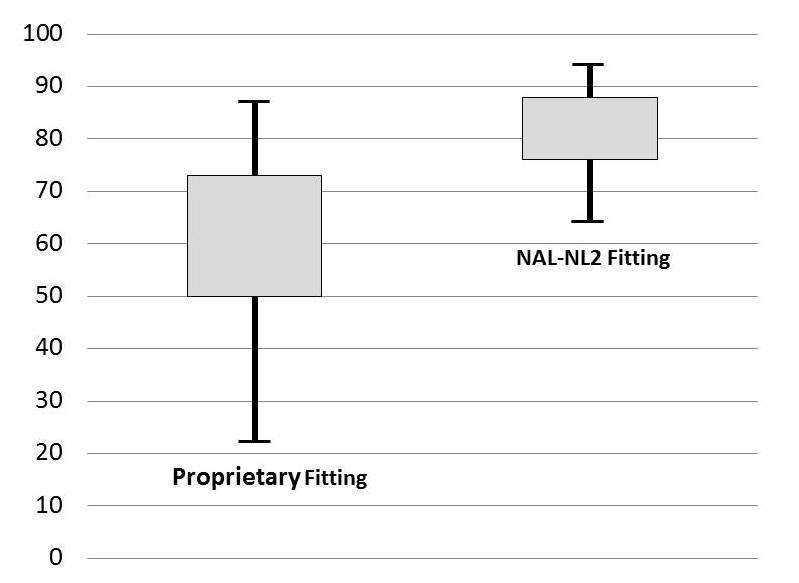
Figure 4. Speech recognition results for soft speech showing findings for proprietary fittings vs. NAL-NL2 fittings. Box plots represent 25th-75th percentiles.
12. What about the real world? Was there also an advantage noted there?
Yes. There was a significant advantage for the NAL-NL2 fitting (compared to the proprietary) observed with the self-assessment ratings of the APHAB (note: it was a cross-over design so all 24 participants had both conditions). This fit-to-target benefit, by the way, is consistent with the findings of Abrams, Chisolm, McManus, & McArdle (2012) in a similar study. I have plotted the APHAB findings from Valente et al. (2017) in Figure 5, and for interest, added the APHAB norms for elderly individuals with normal hearing from Cox (1997). Two things are apparent: 1.) The NAL-NL2 fitting is superior to the proprietary default, and 2.) When fitted to the NAL algorithm, the real world performance for this group of hearing aid users was equal to individuals with normal hearing. Given that we know this - why would anyone not fit their patients to a validated prescription?
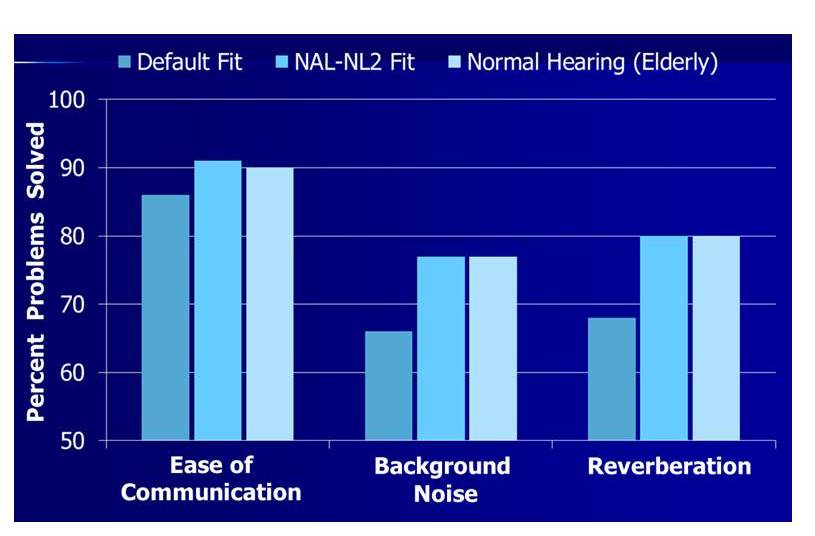
Figure 5. APHAB performance (percent problems solved) for the Ease of Communication, Background Noise and Reverberation subscales comparing the proprietary (default) fitting and the NAL-NL2 fitting. For comparison, also shown are the normative data from Cox (1997) for elderly with normal hearing. Adapted from Valente et al., 2017.
13. I thought I was asking the questions! Do we know that people who are buying hearing aids really are being fitted poorly?
We have a good idea that this is the case, yes. Here is a snapshot from the state of Oregon. Leavitt, Bentler and Flexer (2017) reported on probe-mic measures for a total of 97 individuals (176 fittings) who had been fitted at 24 different facilities within the state of Oregon. The participants were current hearing aid users and were wearing hearing aids that came from 16 different manufacturers; the average age of the product was 3 years. These researchers found that in general, all the patients were under-fit. When rms errors were computed, they found that 97% of the patients were >5 dB from NAL-NL2 target, and 72% were >10 dB.
14. Maybe these individuals were originally fit to NAL target, and then simply turned down gain?
Reasonable question, as I assume the testing was conducted with the hearing aids “as worn.” It could be that that contributed somewhat to the overall findings, but if we look at frequency-specific data, we see that the measured output at 3000 Hz deviated from target (below) by 6 dB more than at 2000 Hz, and the deviation from target for 4000 Hz was 9 dB greater than at 2000 Hz. If the hearing aids had originally been fitted to target, and the patients then turned down gain, the deviation from target would have been the same for all frequencies.
15. I’m now understanding that fitting to a prescriptive target will lead to better outcomes, but why the need for probe-mic verification? Why not just select the NAL-NL2 algorithm in the fitting software?
That’s easy to answer—because in the majority of cases, you won’t end up with a NAL-NL2 fitting in the ear canal. It may be true that a rose is a rose is a rose, but I can assure you that the NL2 is not always the NL2, regardless of what the fitting screen simulation might display. This is something that we looked at in the research that I mentioned earlier (Sanders et al., 2015). In Figure 6 you can see a sample of what I mean.
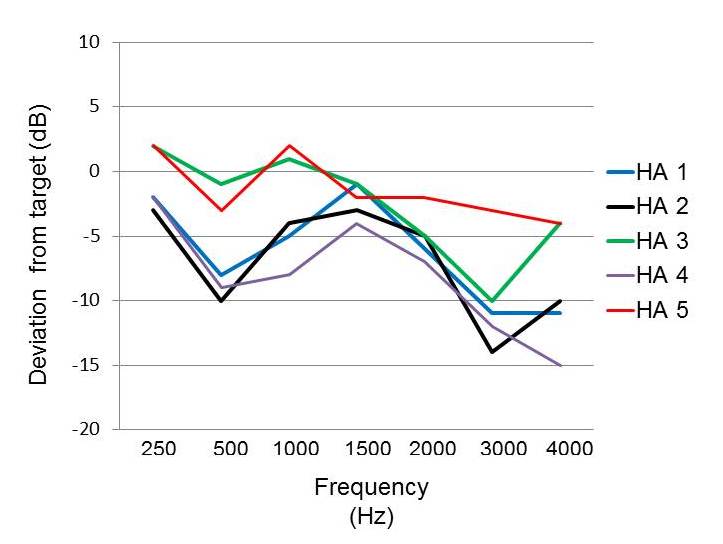
Figure 6. Mean deviation from NAL-NL2 target based on real-ear measured output (55 dB input signal; n=16) for the premier hearing aids from the five leading manufacturers. Hearing aids programmed to the manufacturer’s NAL-NL2.
These are the results for a 55 dB SPL speech-signal input, averaged over 16 ears for the premier product of five different manufacturers. What you see is the mean measured deviation from the REAR NAL-NL2 target. It is very important to note that in all cases, the deviation from target on the manufacturer’s fitting screen was no more than 1 dB. While you might be patting yourself on the back for being a good person and fitting to target, it’s very possible you could be missing target by 10 dB or more in the high frequencies (one exception, Hearing Aid 5, was within 5 dB for all frequencies).
A recent study by Amlani, Pumford and Gessling (2017) reported very similar results. They found that the manufacturer’s NAL-NL2 fitting, on average, fell nearly 10 dB below real-ear NAL targets. They report that for a 55 dB SPL speech-signal input, the average SSI for the manufacturer’s NAL fitting was about .46, compared to about .59 that would have been obtained with a true real-ear NAL fitting for their participants (n=60).
16. All these studies have been with the NAL-NL2. Would I expect to see the same disconnect between the fitting software simulation and the real-ear results with the DSLv5?
I don’t know that that study has been conducted, but my bet would be that the match would be much closer, and here's why. Susan Scollie, PhD, from DSL headquarters at Western University tells me that when they transfer DSLv5 for implementation, the hearing aid company signs a license agreement that specifies a list of minimum implementation requirements. This means that the manufacturer has to create software menus and/or behind the scenes software corrections that will calculate the DSL targets using the correct definitions of transforms, headphone type, etc. The manufacturer must also agree to send in their software and a sample hearing aid for testing at DSL headquarters before the software can be released. Susan mentioned that it sometimes takes more than one version of the software to meet the entire list of requirements. I would think that this process would lead to a pretty good match between what you see on the manufacturer’s fitting screen and the average real ear output. Of course, you will always have some fitting errors simply because of differences among ears, but those differences should be both above and below target, not the large drop-off in the high frequencies that we typically see for the NAL-NL2 (more on this in Mueller et al., 2017).
17. Good to know. Earlier in our conversation you mentioned a potential move toward unbundled pricing in the selling of hearing aids. Where is this coming from?
Recall that earlier, when we were talking about OTC hearing aids, I reviewed all the different groups and committees that had met over the past couple years. One of them was the NASEM, who indeed recommended the new category of OTC hearing aids. One of their other recommendations (Goal #9), in part, goes like this: “Hearing health care professionals should improve transparency in their fee structure by clearly itemizing the prices of technologies and related professional services to enable consumers to make more informed decisions.”
I suspect this hasn’t gone unnoticed by the FTC. A bundled pricing structure, where the cost of the hearing aid and all of the professional's services are included in a single price to the consumer, may not be as much of an option in the future as it is today. How this relates to our topic of verification is obvious. If your livelihood depends on your services, then you really need to have services!
But really, the motivation to verify shouldn’t be about how to be more profitable. It should be about doing what is right for the patient.
18. Do you really think it matters to the patient if we do the probe-mic verification?
Absolutely it will matter, as they will end up with much better fittings, which will lead to better outcomes. This is not my speculation; this has been documented in the research I’ve mentioned here. We haven’t even gone into how a good fitting might make the patient more social, and as we know, social isolation is linked with cognitive decline. Consider the research from Leavitt and Flexer (2012) where they compared QuickSIN scores for proprietary fittings to an NAL-verified fitting for the premier model hearing aids from the big six manufacturers. They found that, on average across products, fitting to the NAL prescriptive target improved the QuickSIN score by 6 dB (vs. the proprietary), and for some manufacturers, the difference was as much as 9 dB. Improving the SNR by 6-9 dB is a game-changer for many patients—this will dramatically affect what events they will go to, what parties they attend, and where they go out to dinner (or if they go out at all). Conducting this testing also improves our professional image, which gives the patient more confidence in our treatment and recommendations.
19. Improved professional image? We know this, or is this just your assumption?
We know this. Several years ago, as part of MarkeTrak VIII, Kockin reported on patient loyalty as it related to the testing conducted at the time of the hearing aid fitting (Kochkin, 2011). His data combined probe-mic measures with other verification/validation procedures. His findings showed that patient loyalty went from 57% to 84% when verification/validation was conducted.
The value of probe-mic measurements recently was looked at more specifically by Almani, Pumford and Gessling (2016). These authors designed a unique study where groups of patients were fitted with hearing aids; the only thing different in the fitting process was that half of each group received probe-mic verification and the other half of the group didn’t. The three groups were: experienced users, owners but not regular hearing aid users, and new hearing aid users. One of the measures studied was willingness-to-pay. That is, what did the patient believe the fitting process was worth? For this study, the patient was told that the “typical” value was $250, and this served as the anchor. The findings for all three groups were fairly similar, so we’ll only look at the experienced users to make my point (Figure 7).
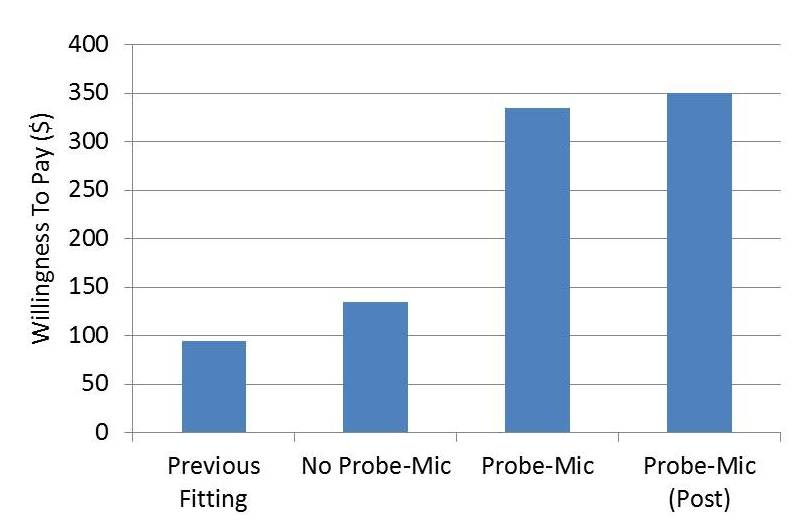
Figure 7. The willingness to pay (in dollars) for a group of experienced hearing aid users being fitted with new hearing aids. The judgement was anchored at $250.00. Shown on the chart (left to right) are the following: amount for previous hearing aid fitting, amount for current fitting without probe-mic testing, amount for current fitting with probe-mic testing, and the amount for the half of the group who were initially not fitted using probe-mic, and then later were (i.e., the 2nd and 4th bars are the same people). Adapted from Amlani, Pumford and Gessling (2016).
What you see on this chart (left to right) is the value placed on the patient’s previous fitting, the current fitting without probe-mic verification, the current fitting with probe-mic verification, and finally, the value assigned by the half of the group who originally did not have probe-mic verification, but then received it later. Clearly, doing this testing has a high impact on the patient’s perception of the fitting process. Note that the value went from $135 to $350 for the group who initially did not have the testing. This same study also examined perceptions of the fitting related to the services obtained, perception of the product, quality value, price value, etc. using a 7-point rating scale. Again, ratings were sustainably higher when probe-mic measures were part of the fitting protocol (see article for details).
20. Better patient outcomes and a better professional image. Verification seems to be a win-win deal. Do you have a final message?
Hearing aid verification should be embraced. It’s what we do better than anyone else. We own the ear canal! Verification to a validated algorithm is not only good for the patient, but good for our profession. Down the road, it just might be what separates us from Aisle 7 of the neighborhood pharmacy. And if you’re really concerned about over-the-counter hearing aids, heed the advice of Catherine Palmer (2017) and make the “counter,” your counter.
References
Abrams, H.B., Chisolm, T.H., McManus, M., & McArdle, R. (2012). Initial-fit approach versus verified prescription: comparing self-perceived hearing aid benefit. Journal of the American Academy of Audiology, 23(10), 768-78.
Amlani, A.M., Pumford, J., & Gessling, E. (2017) Real-ear measurement and its impact on aided audibility and patient loyalty. Hearing Review, 24(10), 12-21.
Amlani, A.M., Pumford, J., & Gessling, E. (2016) Improving Patient perception of clinical services through real-ear measurements. Hearing Review, 23(12), 12.
Cox, R.M. (1997) Administration and application of the APHAB. Hearing Journal, 50 (4), 32-48.
Holube, I. (2015, February). 20Q: Getting to know the ISTS. AudiologyOnline, Article 13295. Retrieved from https://www.audiologyonline.com.
Humes, L.E., Rogers, S.E., Quigley, T.M., Main, A.K., Kinney, D.L., & Herring, C. (2017) The effects of service-delivery model and purchase price on hearing-aid outcomes in older adults: A randomized double-blind placebo-controlled clinical trial. American Journal of Audiology, 26(1), 53-79.
Johnson, E.E., & Dillon, H. (2011). A comparison of gain for adults from generic hearing aid prescriptive methods: impacts on predicted loudness, frequency bandwidth, and speech intelligibility. Journal of the American Academy of Audiology, 22(7), 441-59.
Kochkin, S. (2011). MarkeTrak VIII: Reducing patient visits through verification and validation. Hearing Review, 18(6), 10-12.
Leavitt, R., Bentler, R., & Flexer, C. (2017) Hearing aid programming practices in Oregon: fitting errors and real ear measurements. Hearing Review, 24(6), 30-33.
Leavitt R., & Flexer, C. (2012). The importance of audibility in successful amplification of hearing loss. Hearing Review, 19(13), 20-23.
Mueller, H.G. (2014). 20Q: Real-ear probe-microphone measures - 30 years of progress? AudiologyOnline, Article 12410. Retrieved from: https://www.audiologyonline.com
Mueller, H.G. (2015). 20Q: Today's use of validated prescriptive methods for fitting hearing aids - what would Denis say? AudiologyOnline, Article 14101. Retrieved from https://www.audiologyonline.com
Mueller, H.G. (2017) Why are speech mapping targets sometimes below the patient's thresholds? AudiologyOnline, Ask The Expert 19331. Retrieved from: https://www.audiologyonline.com
Mueller, H.G., Ricketts, T.A., & Bentler R.A. (2017) Speech mapping and probe microphone measurements. San Diego: Plural Publishing Inc.
Palmer, C. (2017). Over-the-counter hearing aids: Just the facts. AudiologyOnline, Recorded Webinar 29858. Retrieved from: https://www.audiologyonline.com
Sanders, J., Stoody, T., Weber, J.E., & Mueller, H.G. (2015). Manufacturers’ NAL-NL2 fittings fail real-ear verification. Hearing Review, 21(3), 24-32.
Valente, M., Oeding, K. Brockmeyer, A., Smith, S., & Kallogieri D. (2017). Differences in word recognition in quiet, sentence recognition in noise, and subjective preference between manufacturer first-fit and hearing aids programmed to NAL-NL2 using real-ear measures. Journal of American Academy of Audiology (in press).
Citation
Mueller, H.G. (2017, November). 20Q: Hearing aid verification - can you afford not to? AudiologyOnline, Article 21716. Retrieved from www.audiologyonline.com

