Question
How are the SII and Percentile Analysis tools used when fitting hearing aids?
Answer
The Speech Intelligibility Index (SII) measures the amount of a given speech signal that is audible to a listener. It can be used when fitting hearing aids as a counseling tool to summarize for the patient how much speech is available with or without the hearing aids. It also can be used to determine if the hearing aids are providing appropriate amount of audibility, and if programming changes are needed.
The SII is a quantification of the proportion of speech information that is both audible and usable for a listener. It is a percentage (between 0% to 100%), and is correlated to the intelligibility of speech. For instance, for understanding words in sentences, an SII score of 25% would predict that about half of the speech for that level will be intelligible for the patient. For an SII score of 80%, we would predict that most of the speech will be intelligible. The prediction will vary depending on the speech signal of interest.
The aided SII is calculated by comparing the individual's hearing thresholds to the aided response curve recorded with a real ear measurement (REM) device for a specific signal type. The points where the aided response curve is higher (above) than the hearing threshold of the patient contributes to increasing the SII. Frequencies that are more important for speech intelligibility (e.g, 1500 to 3000 Hz), will have a greater impact on the SII. The calculation of the Speech Intelligibility Index is available in the Maestro software, REM module from Inventis.
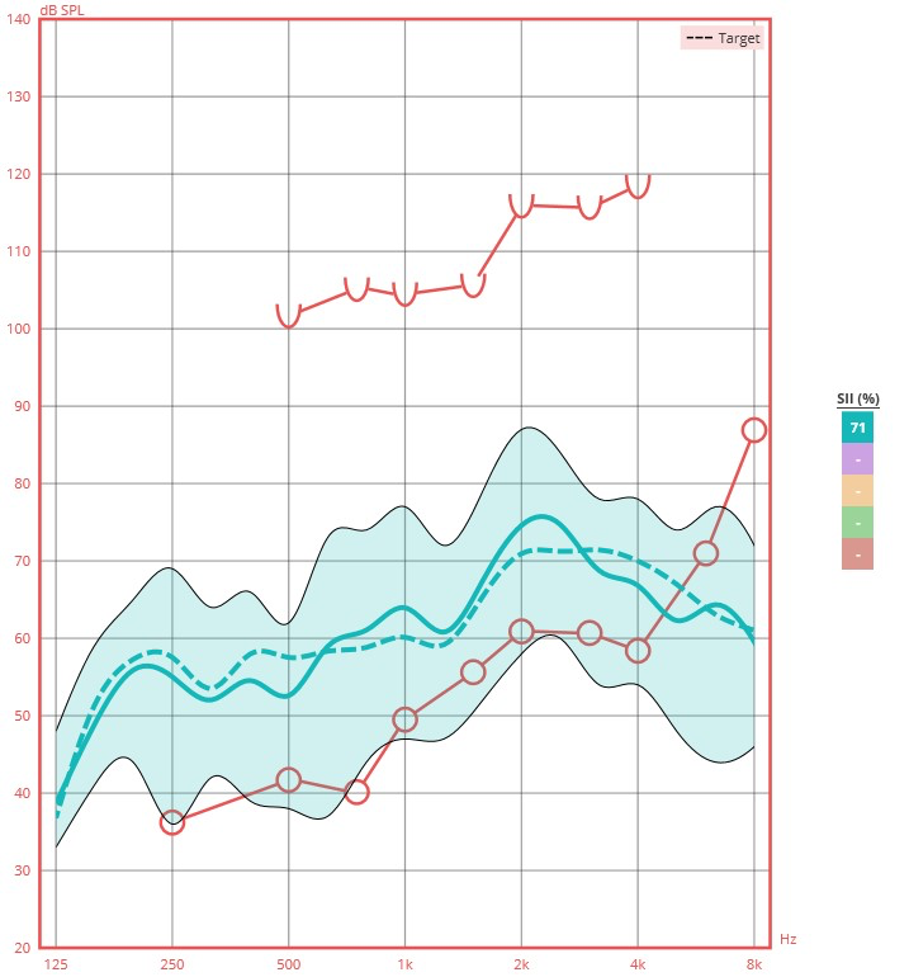
A second helpful option in the fitting software is the Percentile Analysis feature. This is displayed by the 30th and 99th percentile curves; they define the area where more than the 30% and less than 99% of the input speech signal was recorded during the measurement. These values can be useful to show how the hearing aid modifies the range of levels of speech signals of different inputs (typically the difference between the lower and upper levels if around 30 dB)., When the higher levels of speech are compressed, there will be a reduction of the output dynamic range (< 30 dB) in order to avoid discomfort for loud sounds. The time constants of the compression of different hearing aids also can impact the size of the dynamic range.
In general, the Percentile Analysis display can be used to confirm visually that the peaks of the speech (upper percentile) do not exceed the patient’s level of discomfort, and that the valleys of speech (lower percentile) are above the patient’s threshold and therefore audible, for varying input levels (e.g., 55, 65, and 75 dB SPL). The option Percentile, is available in Maestro software, REM module and for coupler measurements.
These are two important developments that make the Inventis Trumpet real-ear measurement system a fundamental first step to start your patients on their journey to better hearing. Figure 1 and Figure 2 show these features in the Maestro software.

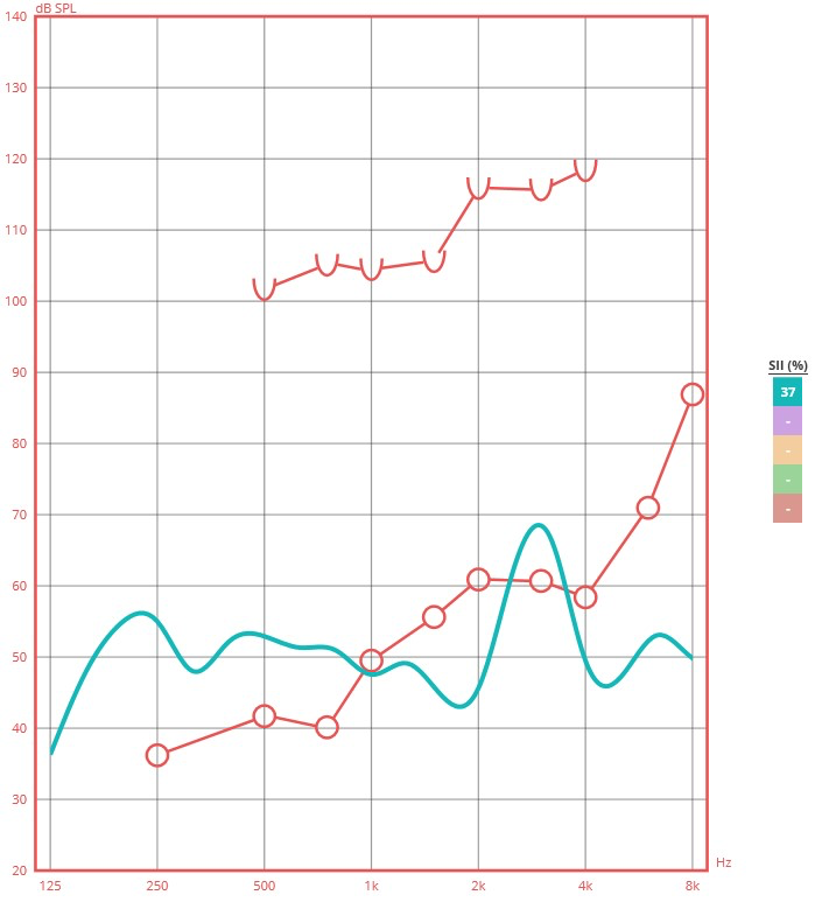
Figure 1. Maestro software, REM-UNAIDED module interface: the light blue continuous line represents the response curve to an ISTS stimulus at 65 dB. On the right, the table with the UNAIDED SII (37%).

Figure 2. Maestro software, REM-AIDED module interface: response curve to an ISTS stimulus at 65 dB (light blue continuous line), and its target curve (light blue dashed line). The colored area is the percentile area. On the right, the table with the AIDED SII (71%).
Comparing Figure 1 and Figure 2, you can see the change in the SII after amplification, from an unaided SII of 37% to an aided SII of 71%.
Resources for More Information
For more information, check out these resources or visit www.inventis.it
AudiologyOnline Webinars:
- Let's Get Real About Outcome Measures: Practice Solutions for Evaluating Success
- Measuring and Assessing Aided Audibility Using the SII
- Symphonia - the Software for Virtual Sound Environment Creation
Videos:

